Every "one shot" is slop.
The myth of "single prompt" AI projects – or how did I build my Isometric World Map
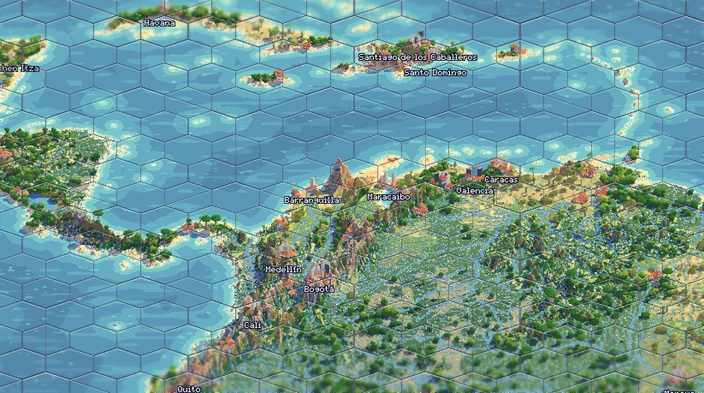
Yesterday I launched a little project called Isometric Earth, where I am trying to render a map of the whole planet as a cute little diorama of earth in pixal art and hexagons, as if you were playing an old Civilization game. I got a lot of feedback from friends and strangers and I would say it came mostly in three flavors: "this is cute", "my town is not right" and "This AI slop and I hate it". I thank the first one, I am working on the second with a new version (scroll until the end to read about it) and want to answer the third type with this blog post. First what is AI slop?
On AI Slop
My opinion is that slop is anything that is low effort, often mass fabricated. While I don't believe that effort is a good measure of quality for anything – you can spend an afternoon in the kitchen and still make unedible dinner – I do believe that any project that is made with care will take many long hours, even with the best tools. Sometimes someone in on the internet might share something they will say it was a "one shot" in a frontier model. These are often people who want to sell you their model, or people who hate AI precisely for making it easy.
But the truth is, when a tool makes something easy, then that simply becomes the standard of low effort. When I started coding websites using a text editor back in the late 90's, just getting anything online was already worth of praise. Then blogs and myspace came, and that became easy, and the new rule to measure against became higher. Making a good website, that looked good, had comments, had proper styles, that became the hard part – until blogging engines like wordpress made that easy also. Soon a basic wordpress template, much like a word document using Calibri, or a default presentation in Keynote, becomes the hallmark of low effort content.
I am a designer, and I love making websites, posters, infographics – and when a new tool allows me to make them faster, well I will not use it to spend less time doing that, I will use it to do things I couldn't ever do before.
2005 Hexagons hexagons
Around 2005, wikipedia was my favorite social website. It's where I would go to have the most pointless discussions or share images I made or discover something new. That's where I first stumbled on the Dymaxion map, a projection by Buckminster Fuller intended to show earth not as series of divided countries but one archipelago of interconnected islands. I immediately fell in love with it, but I was also bothered by the jagged triangles around it, and when I used it to another image on wikipedia–a map of human migrations for which the position of africa at the top was great–the first thing I did was to remove the oceans. I am clearly not the only one who disliked the ocean tiles.
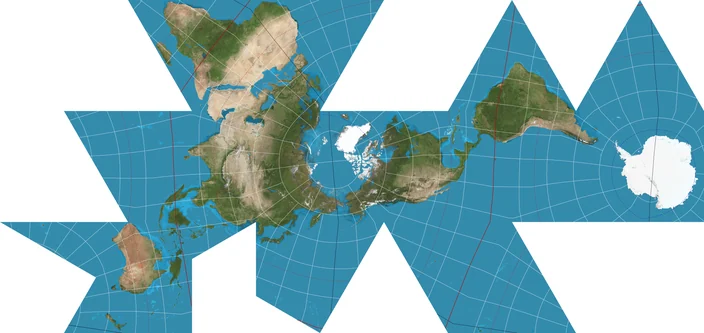
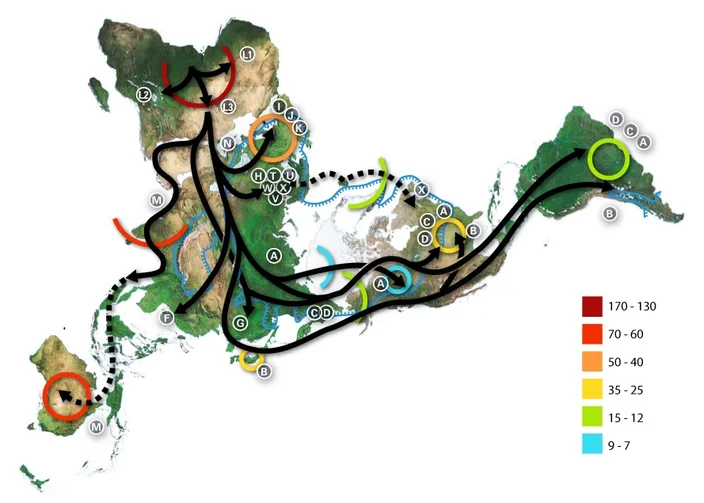
But that's when my love for hexagon based maps started. I always wanted to explore that idea more, but despite doing small work in javascript programming that was beyond my capabilities.
2023 AI can code–barely
Back in 2023 is when I started experimenting with AI assisted coding. As a curiosity I asked ChatGPT a code to build a hexagon grid in Canvas and it got it right the first try. I was amazed and started going a huge rabbit hole of trying to explore hexagonal maps. I had just read a paper about how you can cover a ball with only hexagons using a few unorthodox shapes and wanted to explore that more. I spent months on this on my free time, by coping and pasting code from chatGPT (that was before AI code editors existed) but ended up building a fairly complex tool for personal use that could transform a 2d satellite map into the fractal arrangement I liked.
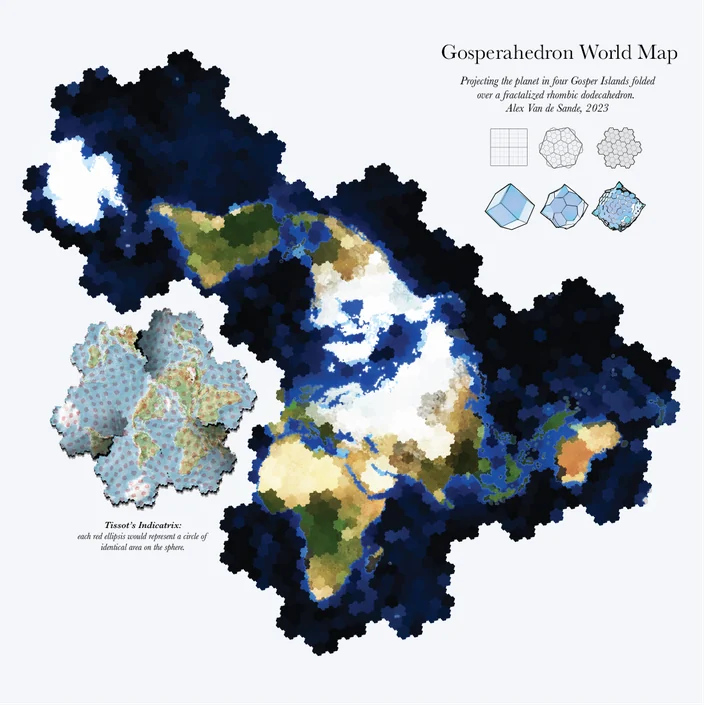
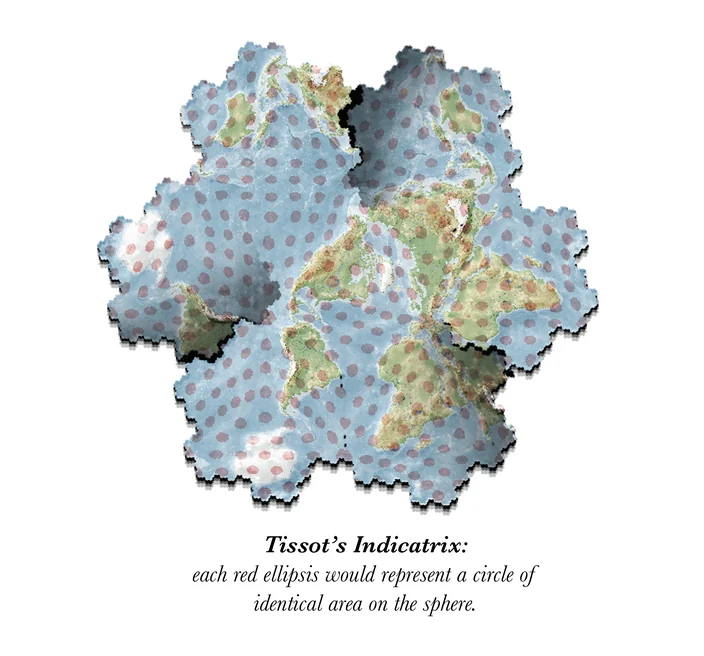
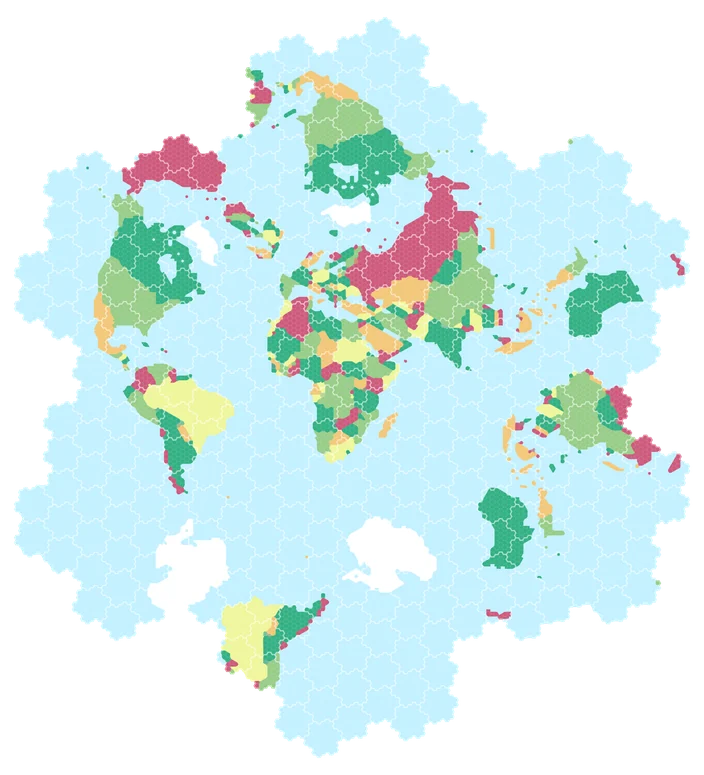
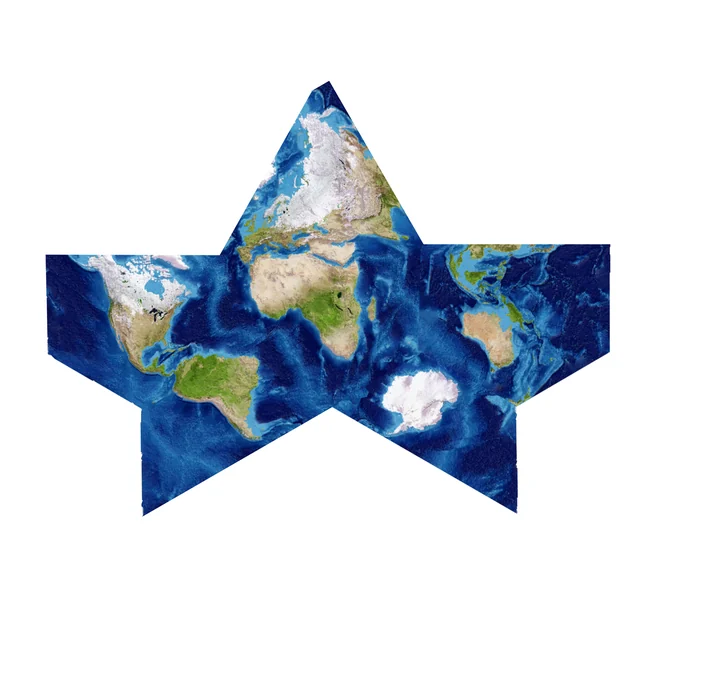
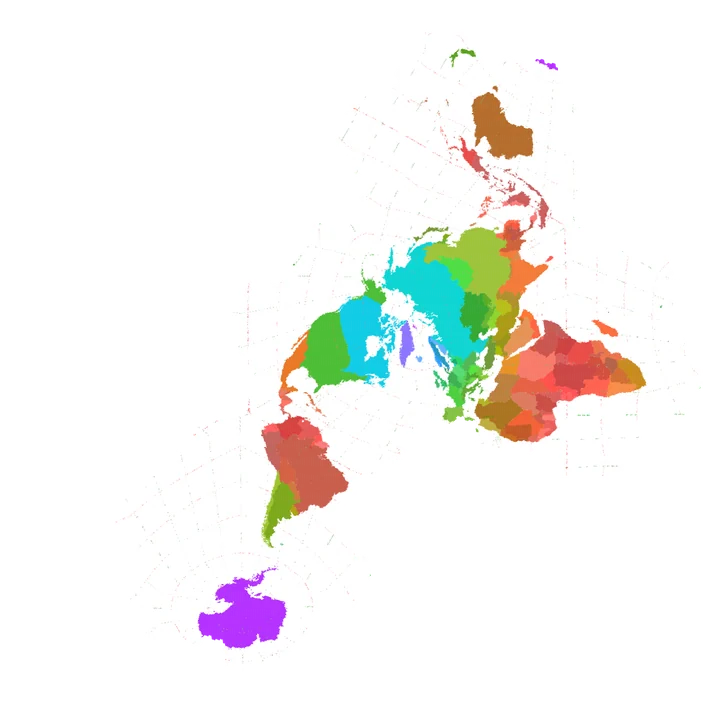
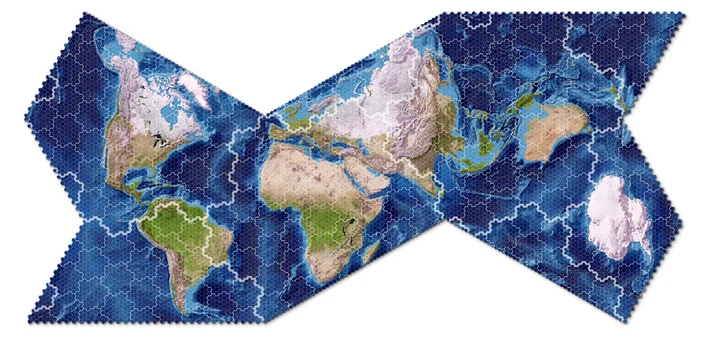
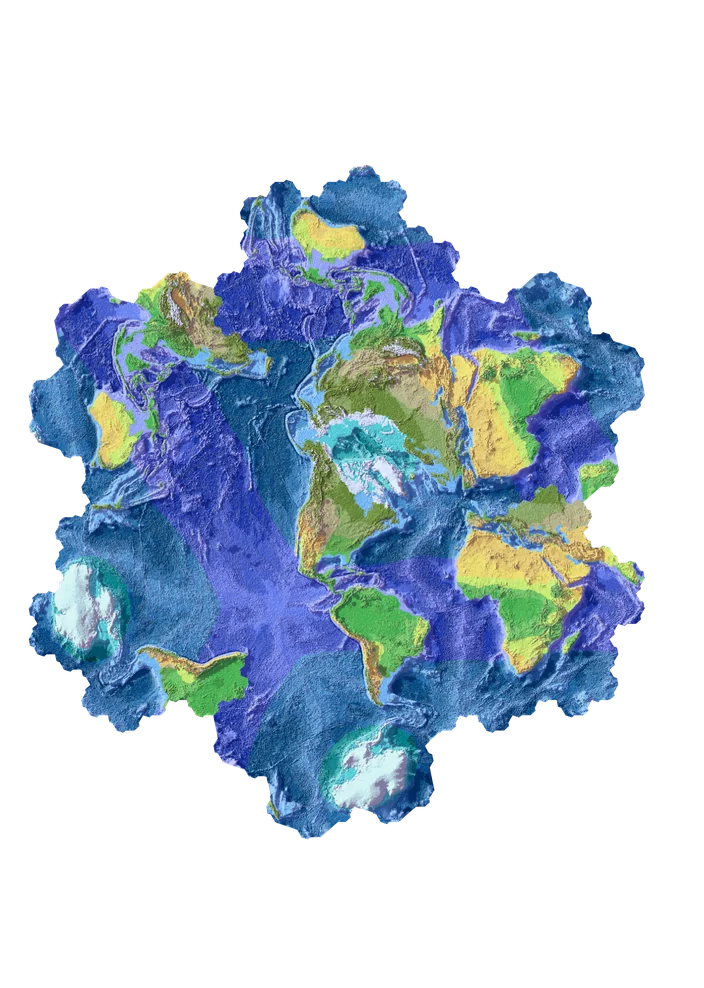
Experiments in gosper shapes for maps, 2023-2024
This eventually led me to publishing a paper in the Bridges journal the year after, which was a super fun experience that led me to meet Matt Parker. But that's another story. The point being, I was thinking about the concept for a long time. The resulting code did the job but it was pure slop, so I never did put it anywhere public.
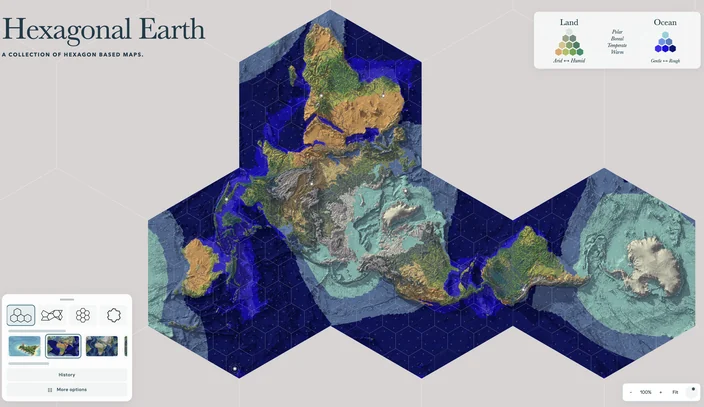
Then comes 2026, and AI coding skills had improved a lot and I decided to ask Codex to reimplement the concept from scratch. Codex – not even sure which version– did the skill in one sitting but, and that's my main point here, I still did not publish it. Instead, I spent the next weeks adding all the features I always wanted the tool to have, true 3d depth, river data, real Lifezone data, political maps etc. I was (I am) still very proud of the site.
A car allows you to drive faster. But average commute time today has not changed much from what it was 200 years ago – people are not using the car to get faster and use the time to sleep more, instead they are using it to go further.
Isometric Earth
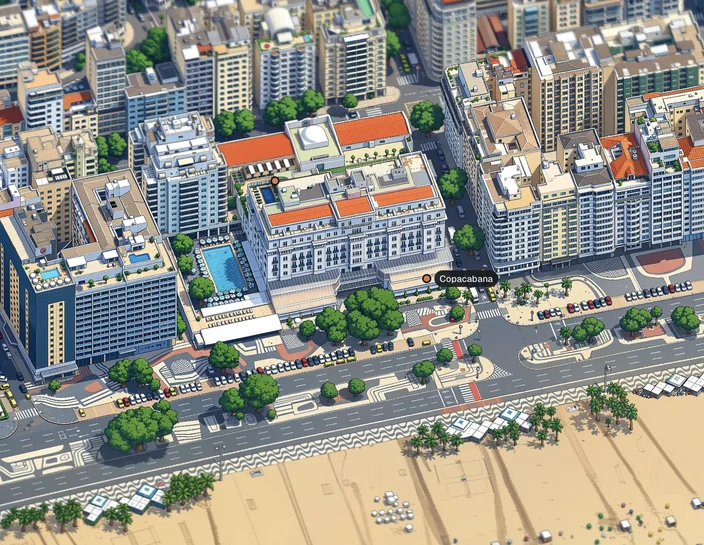
I do these projects partly as a hobby but also as a way to keep me updated with technology, as an exercise. That's when I stumbled on tinyrj.com and loved the project. That, along with a string of many other isometric city projects (like tiny london or the original, tiny ny) all follow a simple pipeline. Download real world data from the cities, combine with satellite photos to make an isometric view of each building, then pass it through an AIGen model to render it as pixel art. Well I have downloaded a lot of world data for hexagonal earth maps and I love Civilization so why not take a different approach and build the world as a Civ Earth map? I was also curious to test the new features of Opus 5.5 so I asked it to convert my maps to 3d hexagonal prisms, and then tried using ChatGPT to convert them into realistic renders. They were honestly crap and I didn't use any of them.
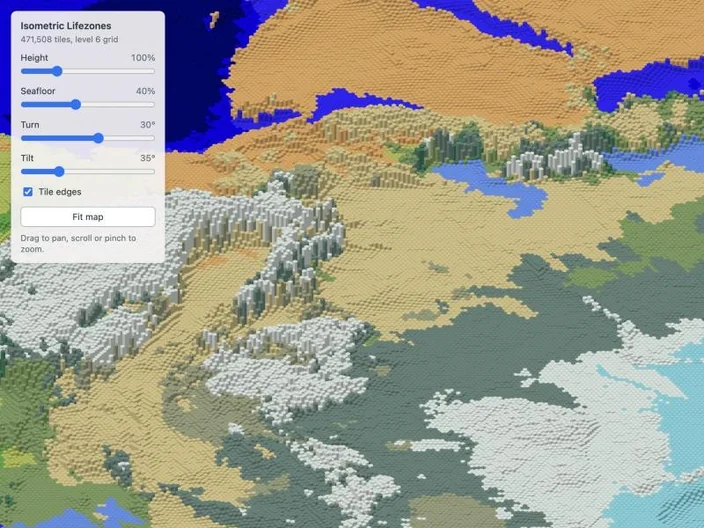
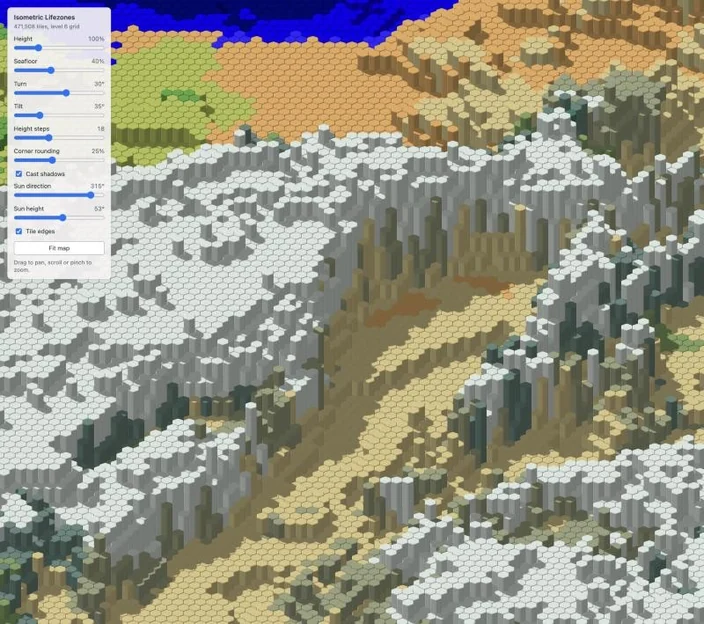
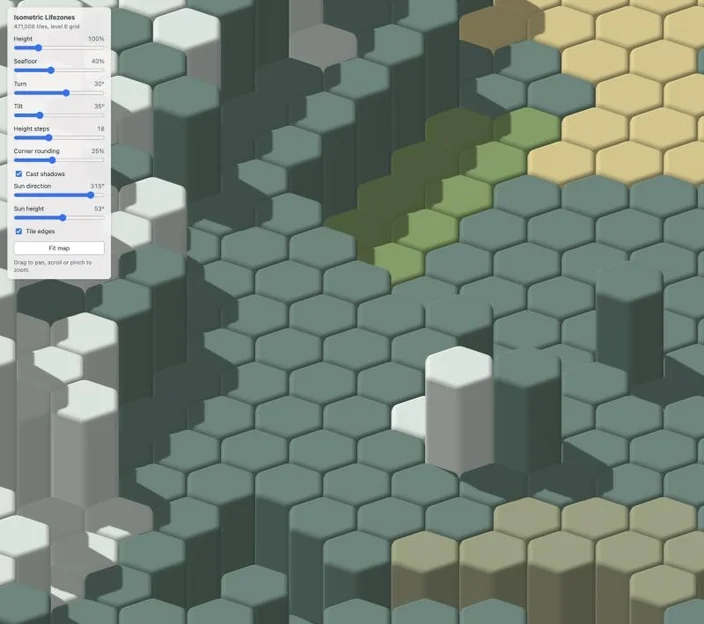
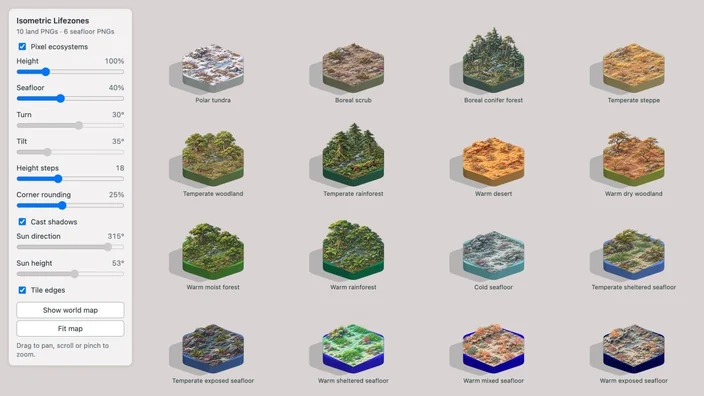
Over the next few days I iterated over the idea of prisms. Maybe if the prisms were not freestanding but had specific heights and ramps. I also tried adding rivers, and rendering the richer ramps as realistic images. This is a common problem with image generated images: they might look nice in isolation but used as a tile, they're often inconsistent.
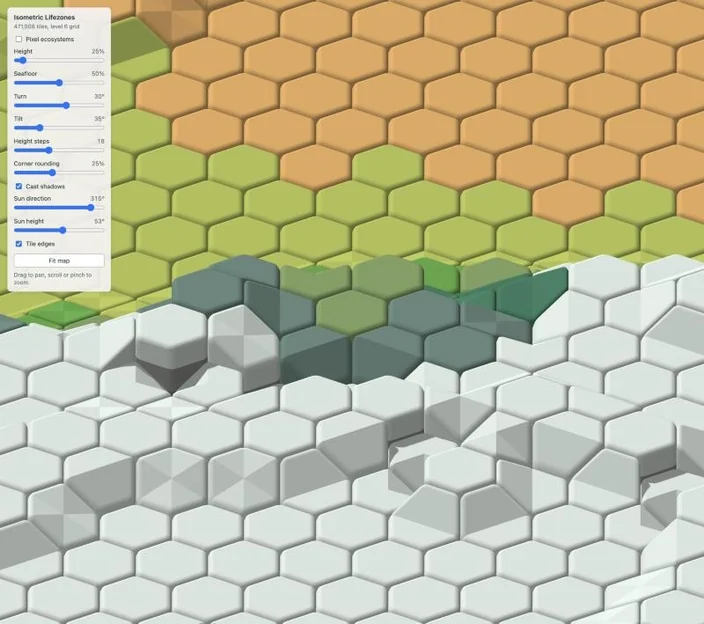
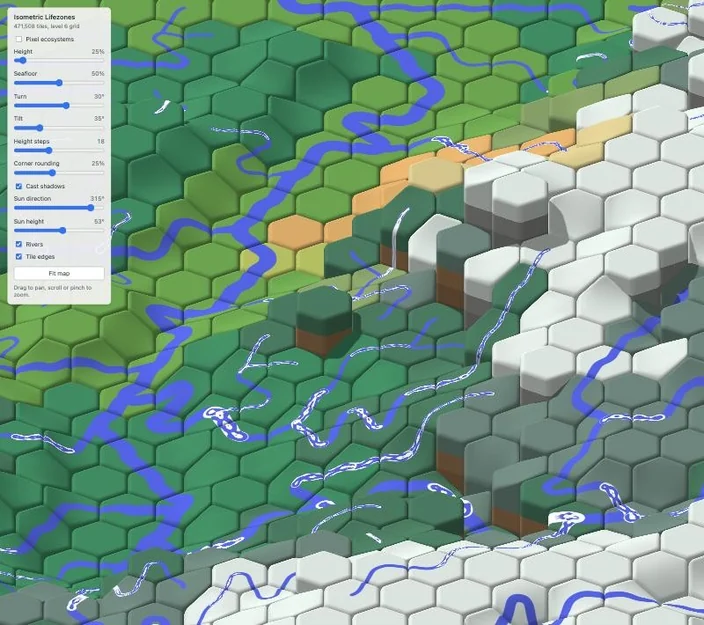
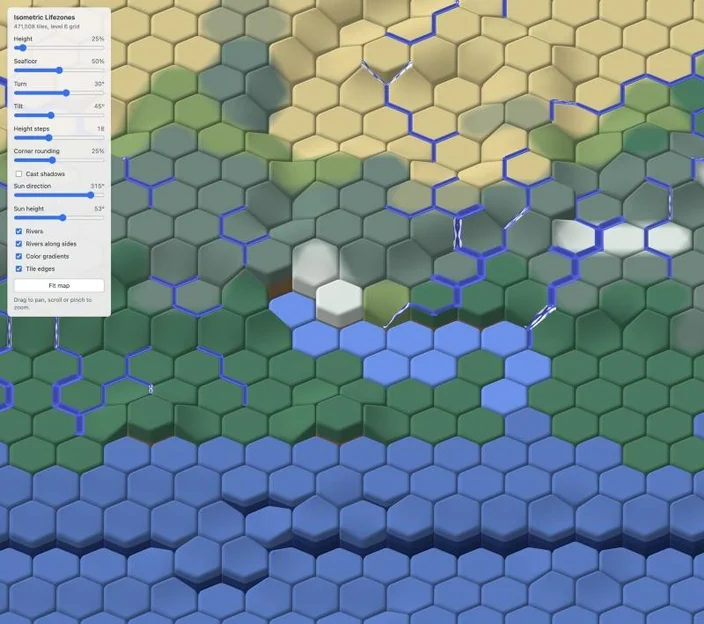
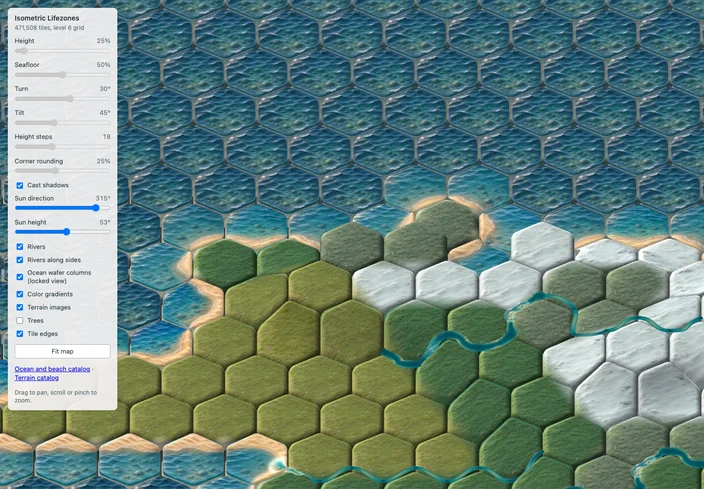
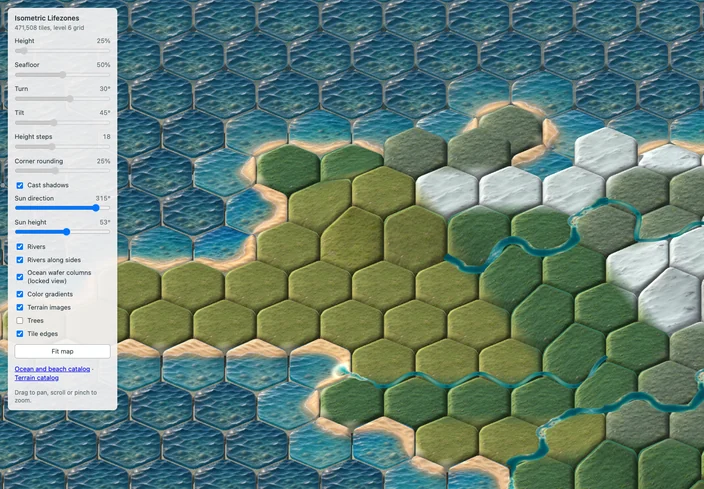
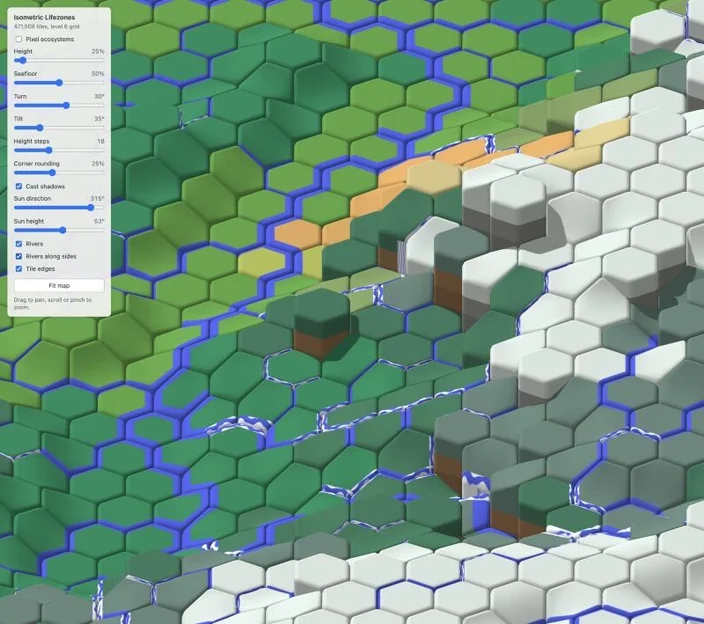
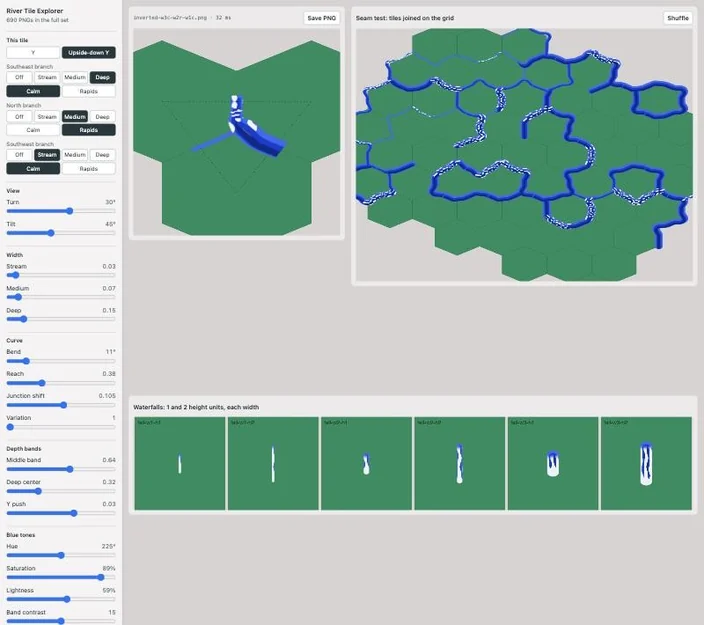
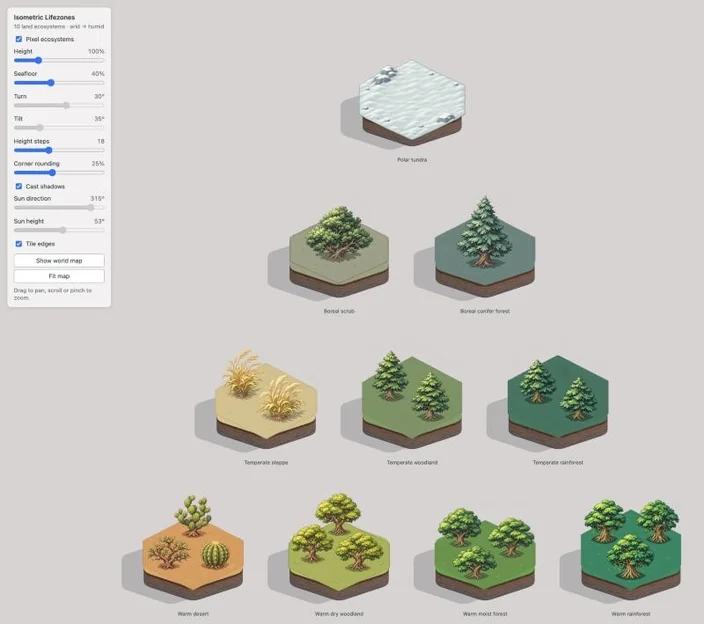
I went a few days doing this and while the 3d tiles were cute, generating anything in chatGPT didn't look much better than what I could do directly in 3d.
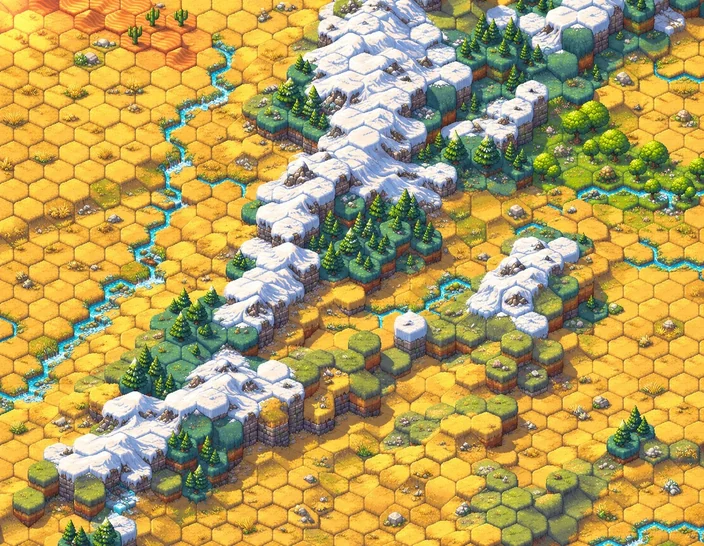
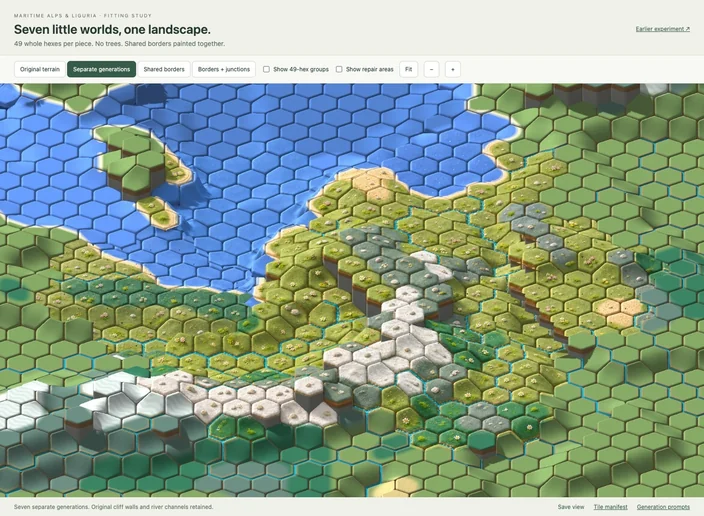
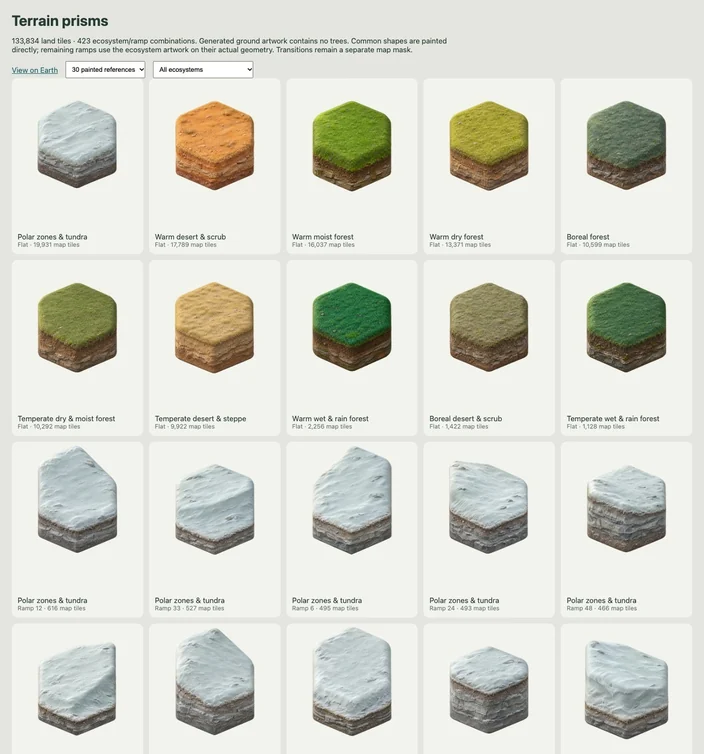
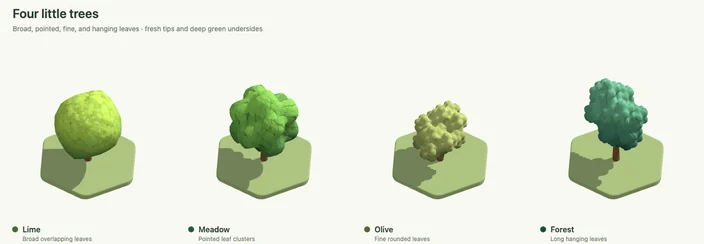
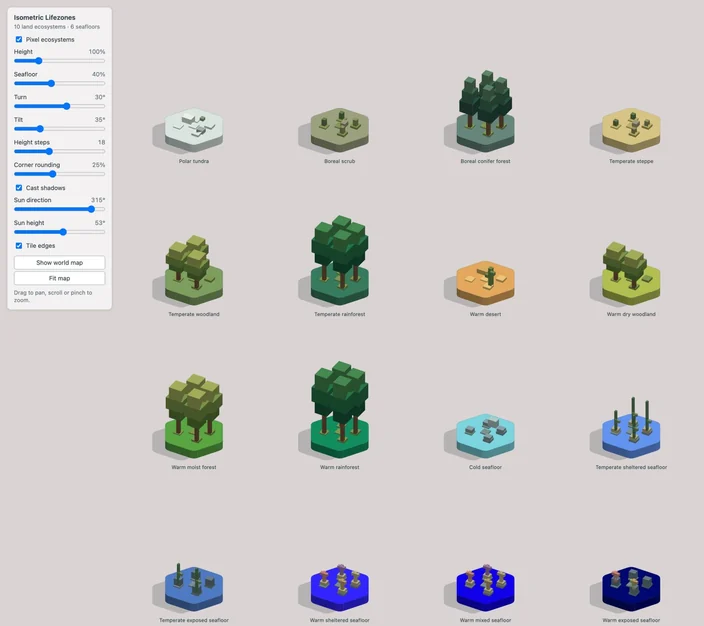
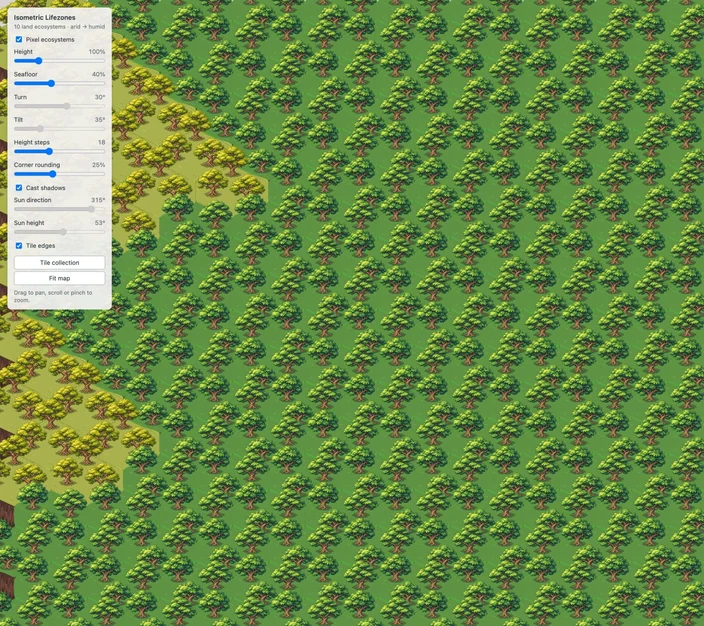
I spent some more days on refining that approach. I was actually quite happy with some of the shots that are more hand drawn, but it was still quite hard to make ChatGPT understand the weird hexagonal geometry I was using.
Go crazy, play around, try anything
But I still felt the project wasn't how I pictured it. I often saw people saying they had wonderful results with a single one shot project, and I didn't feel this was working. I decided to experiment the famous one-shot approach. Fable 5.2 had just been released and I asked it to:
What I am trying: to use that view to create the cutest diorama of the world ever. […] Go crazy, play around, try anything. What about I give you 12 full hours?
I left the computer in a loop and came back 4 hours later and it was done. Honestly the result was amazing: it had regenerated the whole world in these 3d prisms, with a tilt shift effect, animation, railroads, city labels a search. Just a few years ago I would need a full team to build that over months.
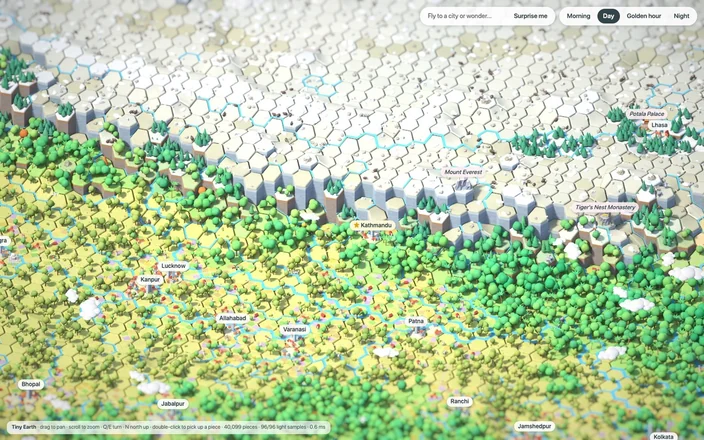
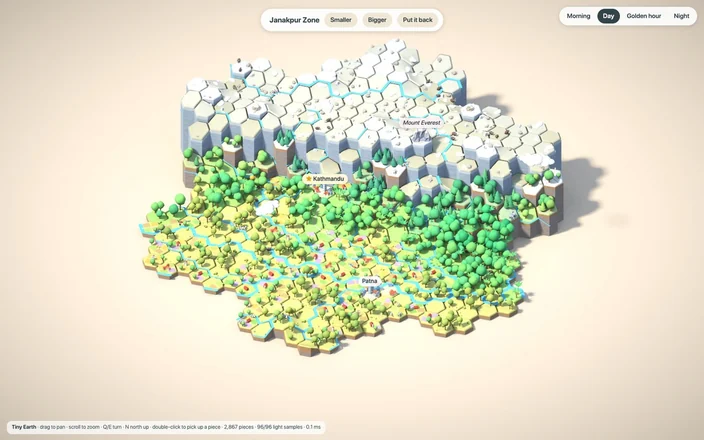
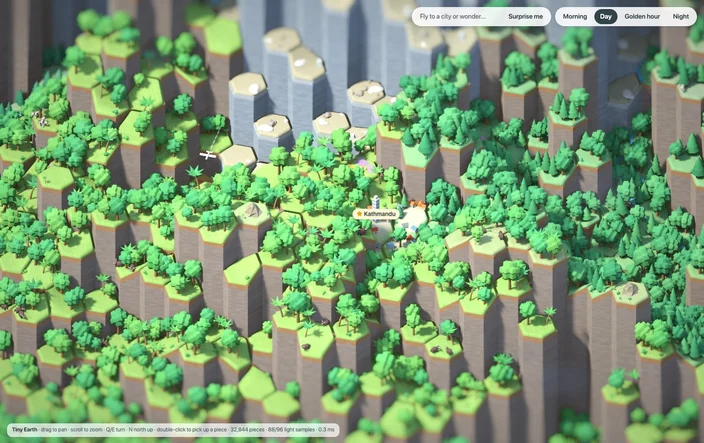
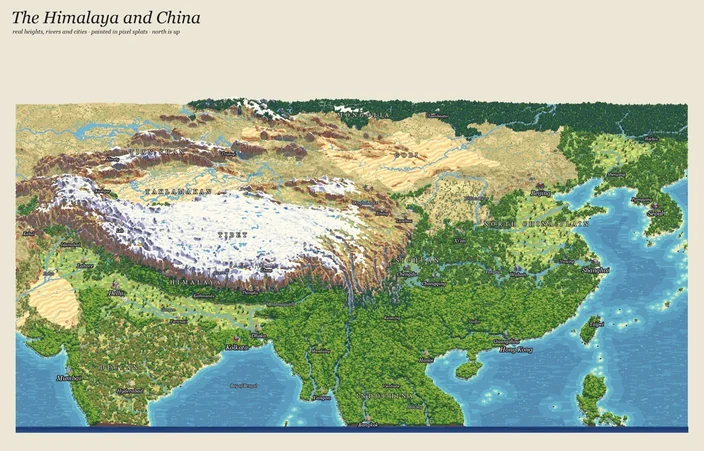
I could have stopped there and released it. But it still didn't feel right. It didn't feel.. mine. I started looking into it deeper and found inconsistencies. I didn't particular like the style, did not like how as you get closer to a high mountain it would look a forest of spires. A lot of back and forth went trying to fix this. I wanted something that felt like pixel art but had the internal structure of a 3d geometry. That's when I learned out about pixel splats. These are 3d images not created by poligons but by placing a cloud of dots in 3d space. They're usually used for turning captured video in a 3d image, but they work great for pixel art. So a new round of work began trying to see if I could use them on top of the hexagons. I would often go in between Fable and Codex for them to generate images between each other.
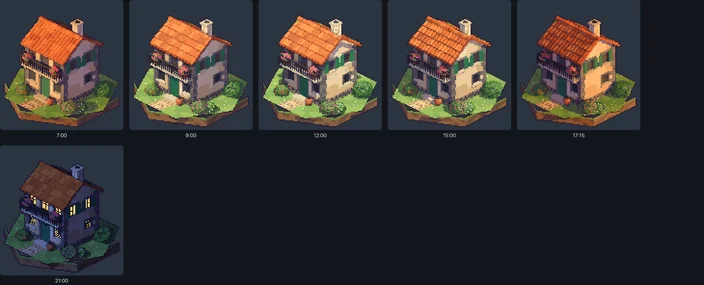
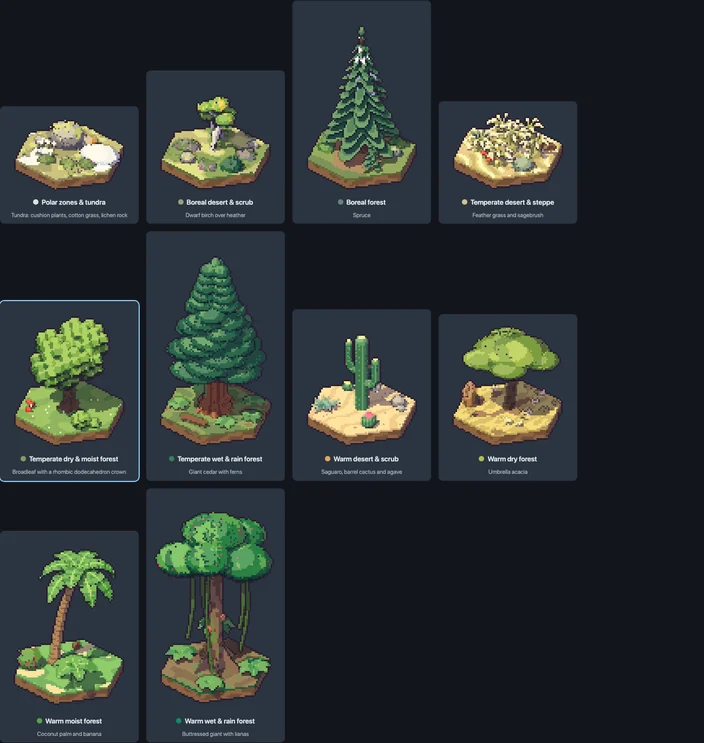
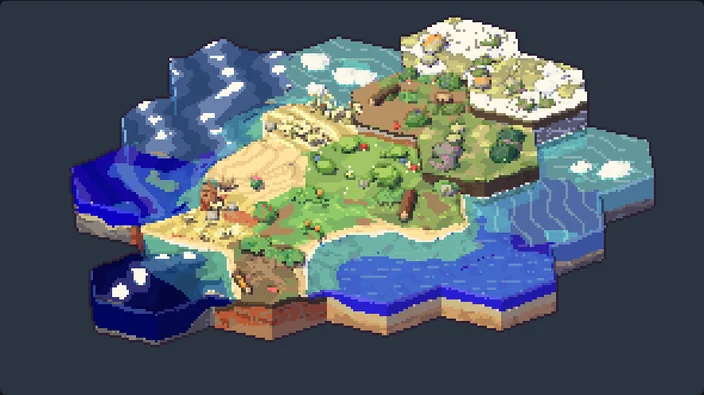
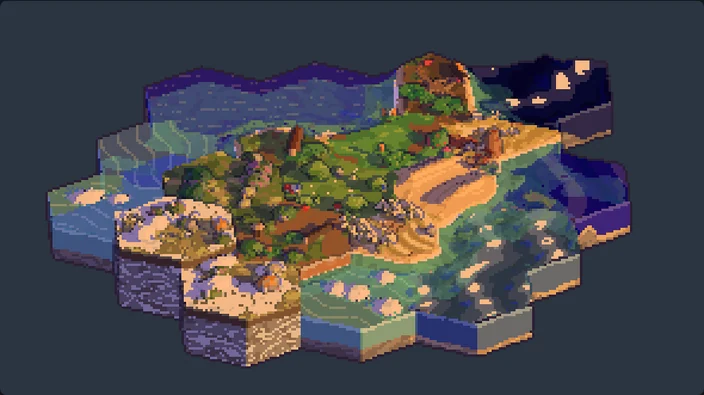
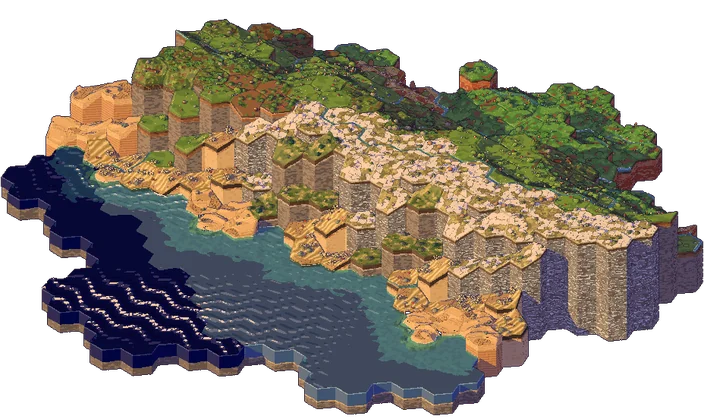
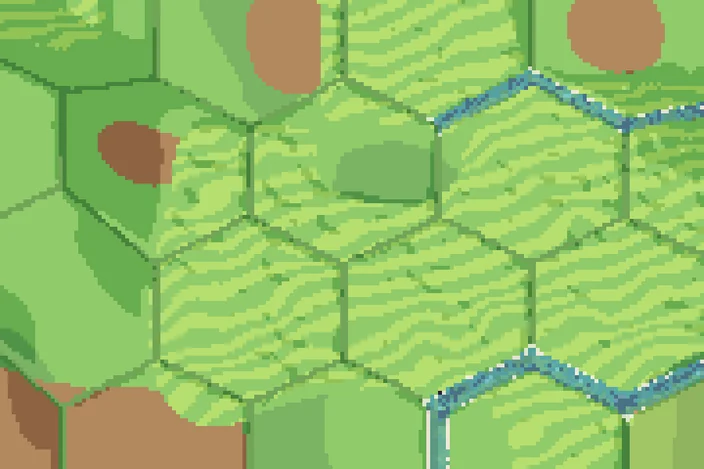
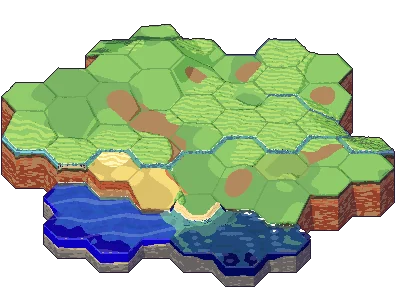
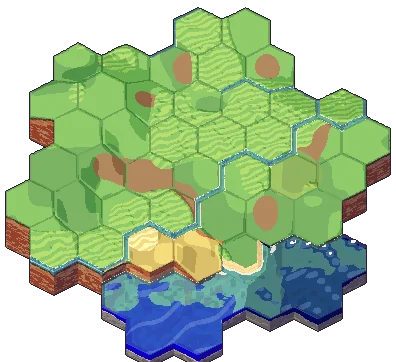
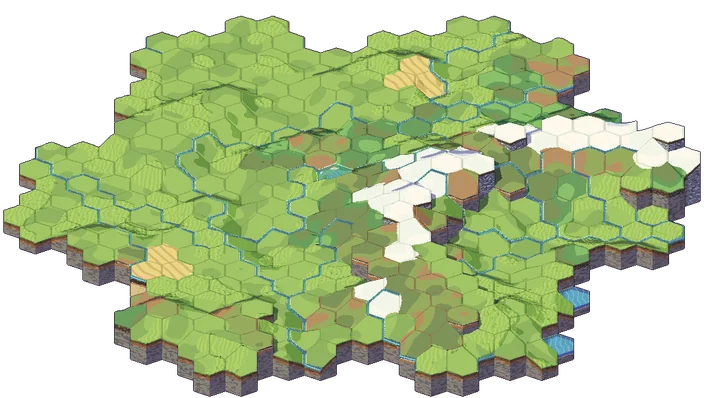
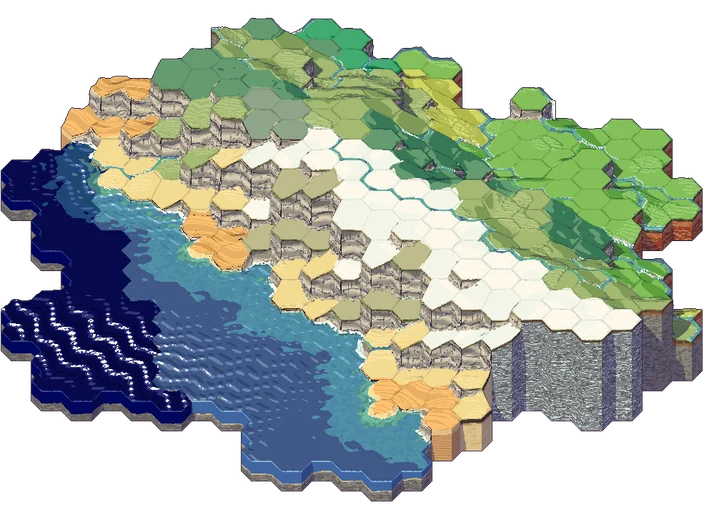
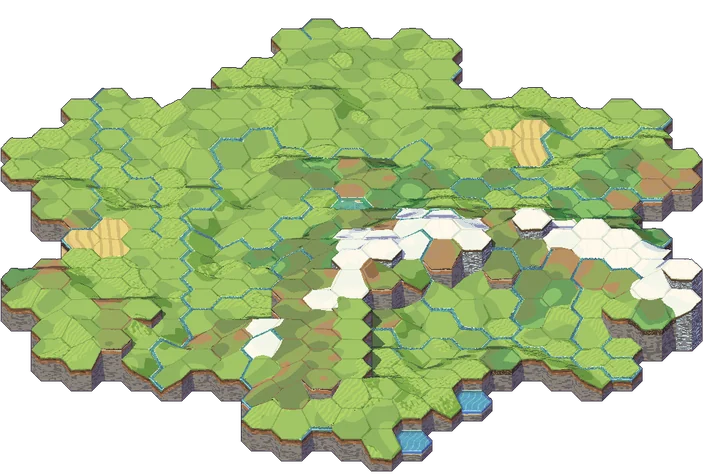
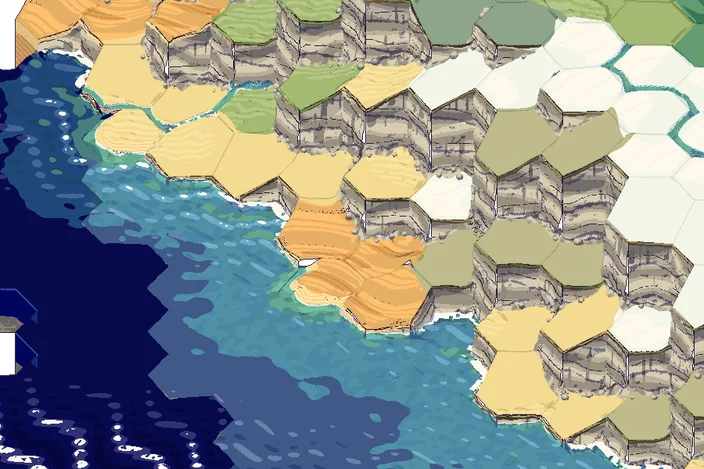
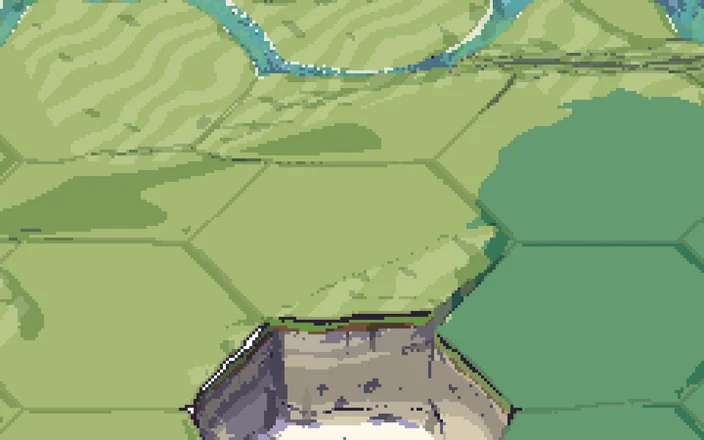
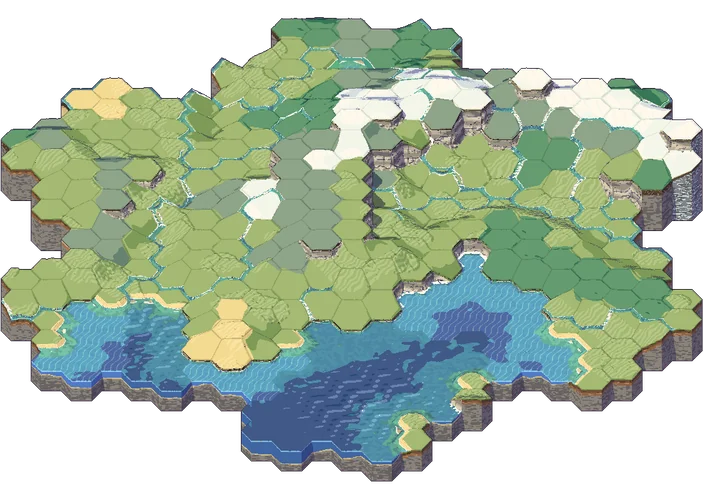
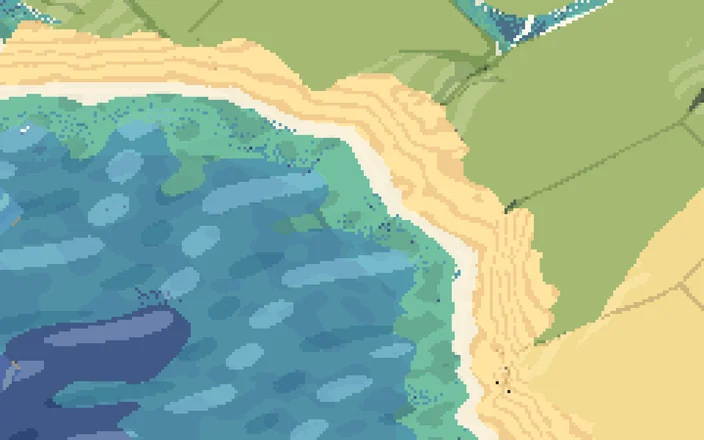
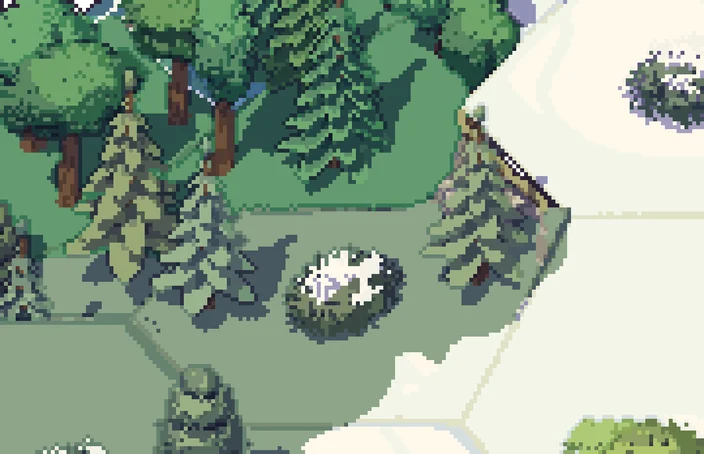
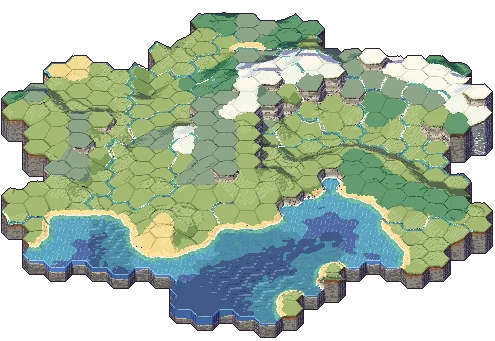
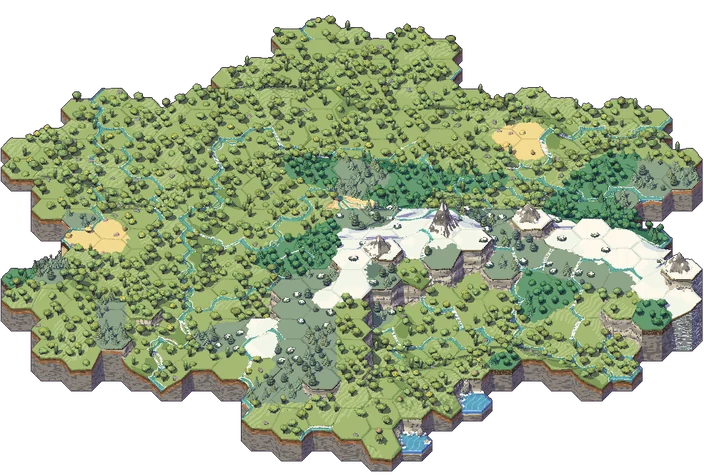
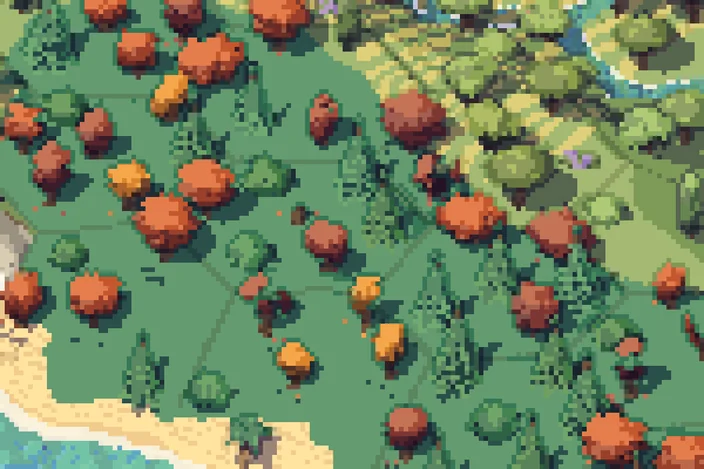
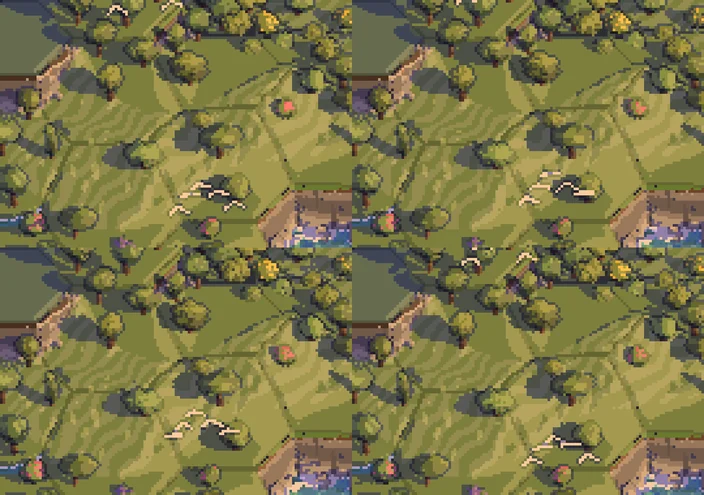
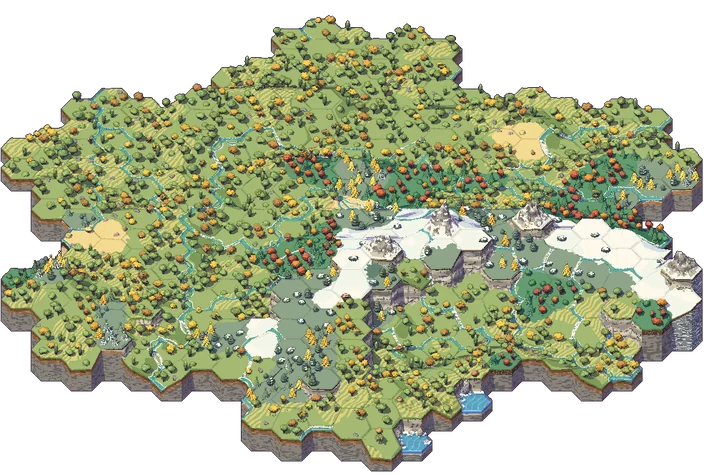
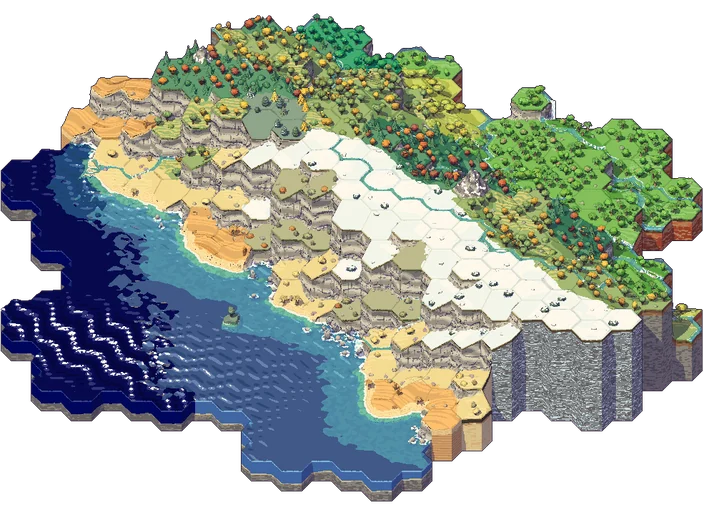
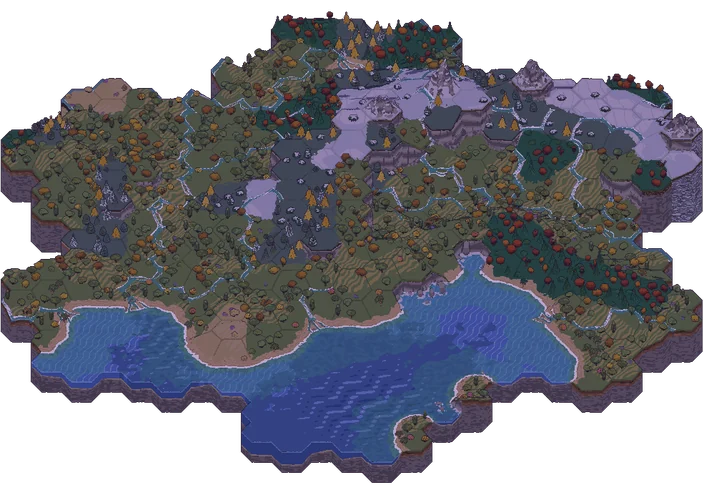
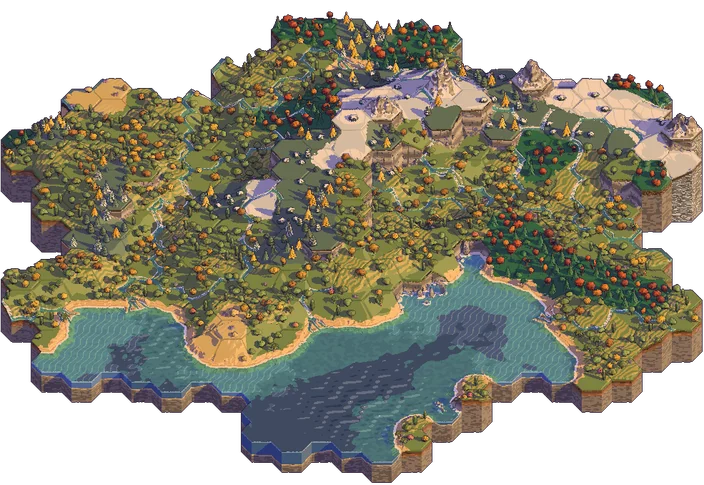
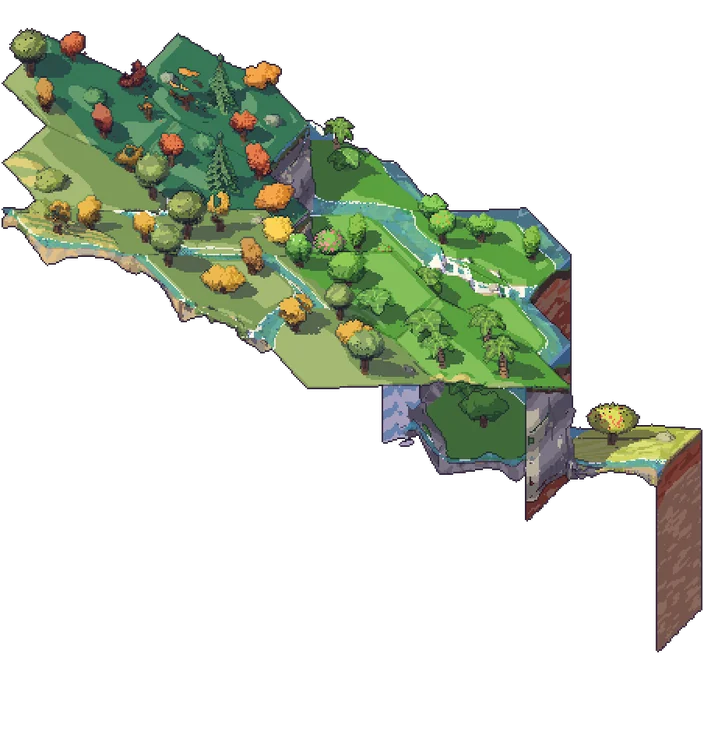
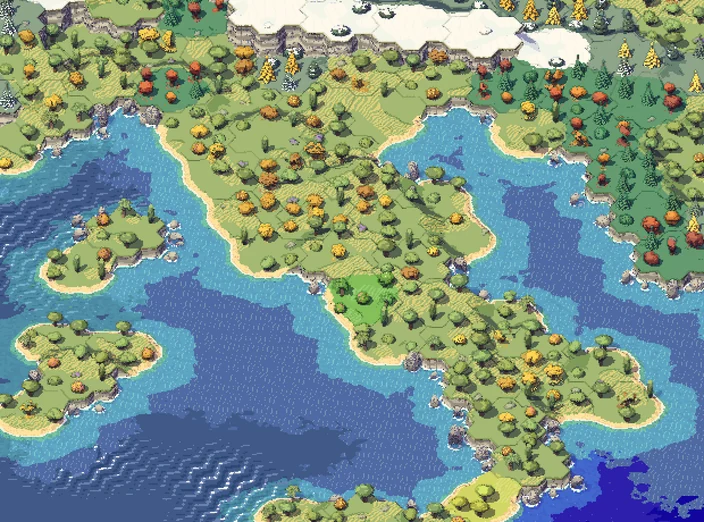
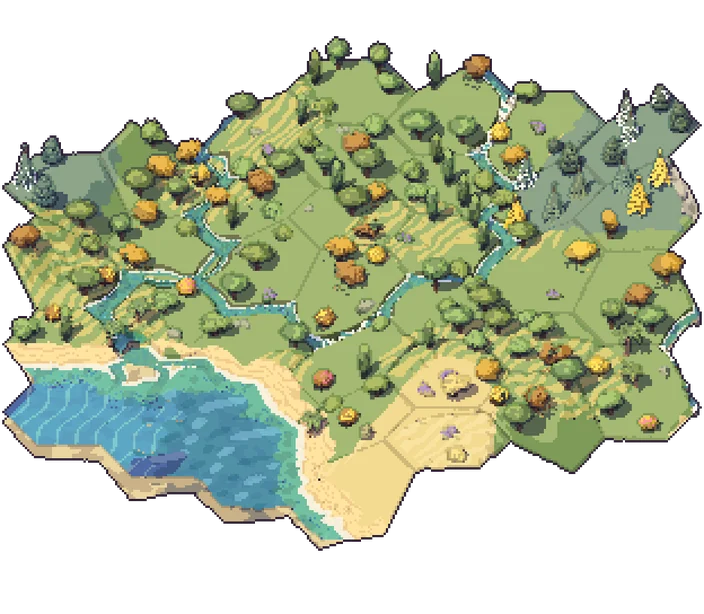
I love some of more illustrated looks these have but I hit a wall that went back all the way to my original prism idea. From far away, even the hymalaias are flat on a map, but if you exagerate it too much at closeup they look like spires. A good solution is to change the height exageration as you zoom in, but if you do that makes it hard to have specific single steps for each hex. So time to go back to the drawing board. And I had a great reference.
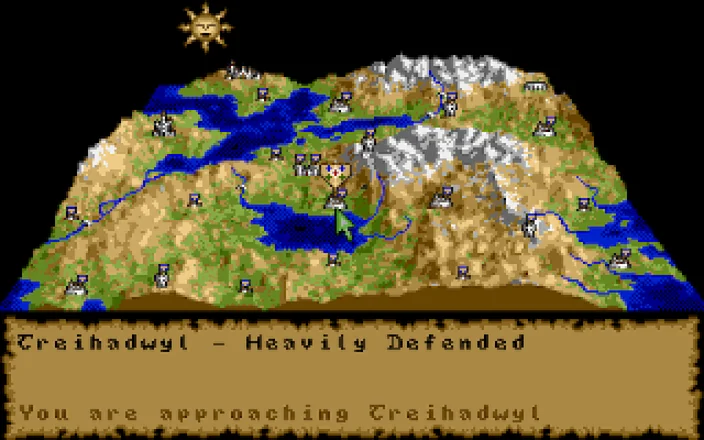
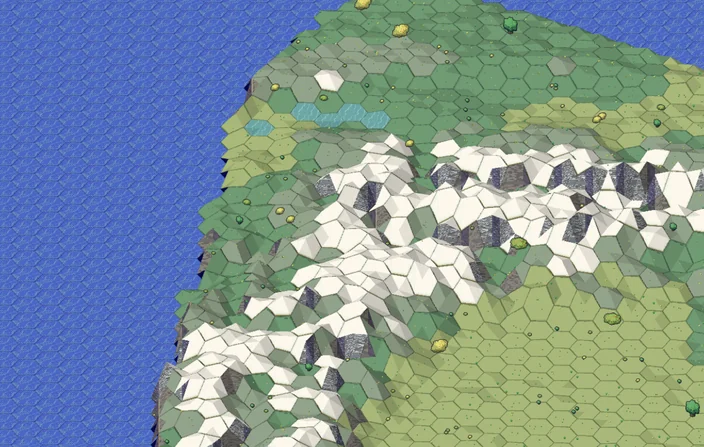
I remember a great game I used to play, with an innovative spell casting gameplay: four crystals of trazere. They also had this gorgeous map. Could I do something similar? So I decided a different direction. Take the average height of each hex, and then as you zoom in, we add another hex level and add that point. It's how Perlin noise works, by adding vertices in a square grid. The map would then distribute the previously generated art in the map. It became less illustrated and more realistic. Maybe too realistic: it looked like a cheap videogame.
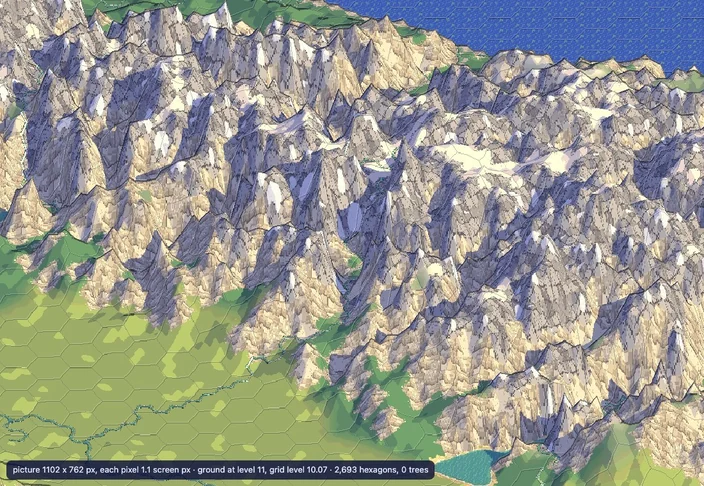
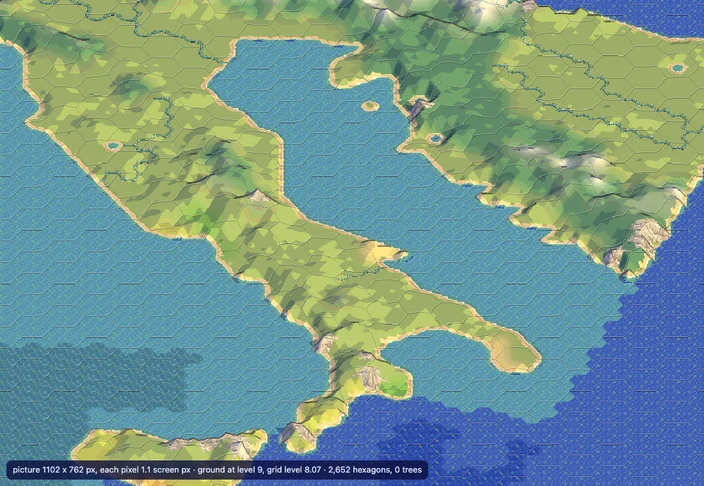
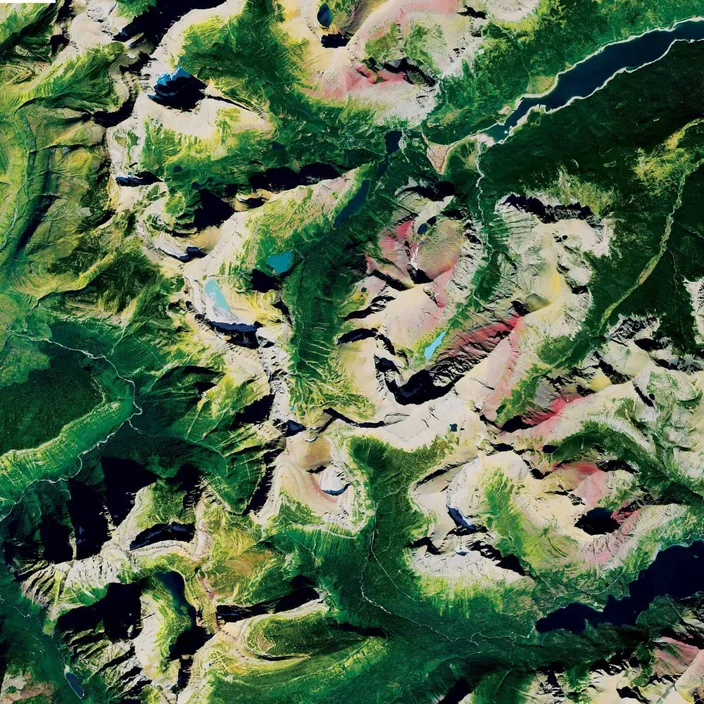
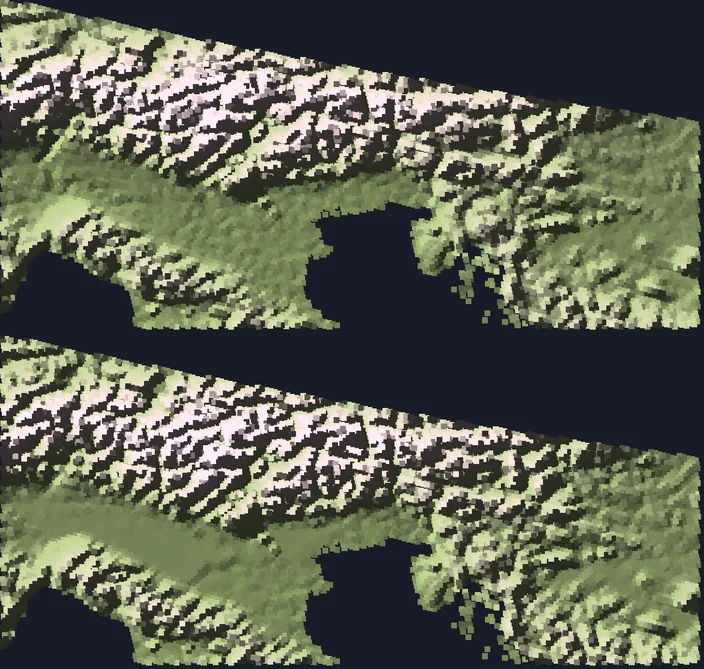
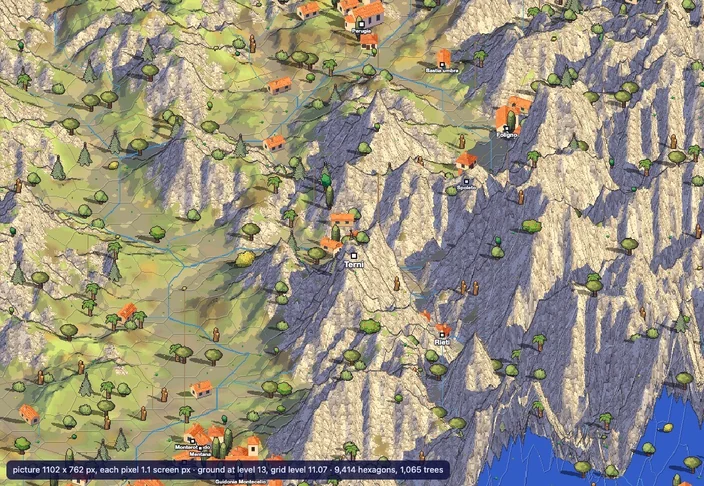
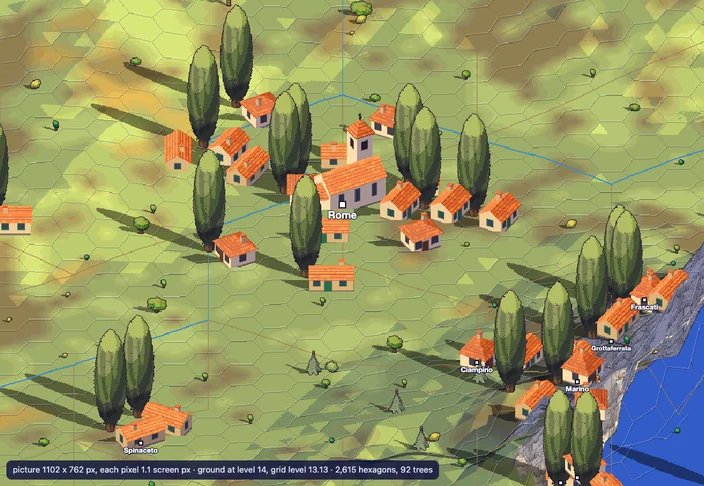
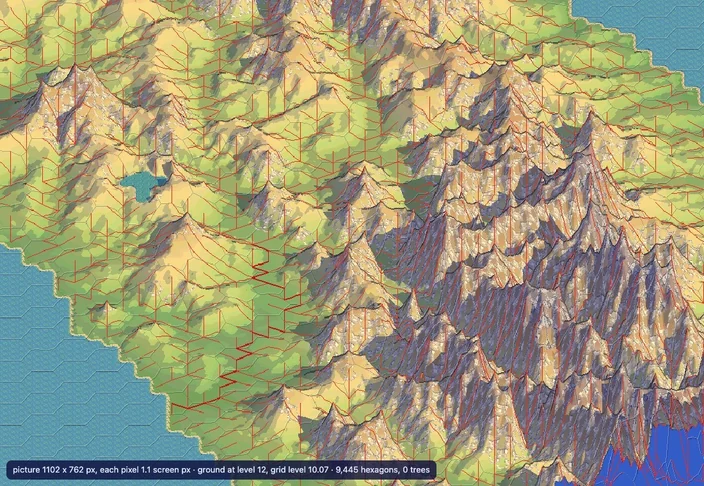
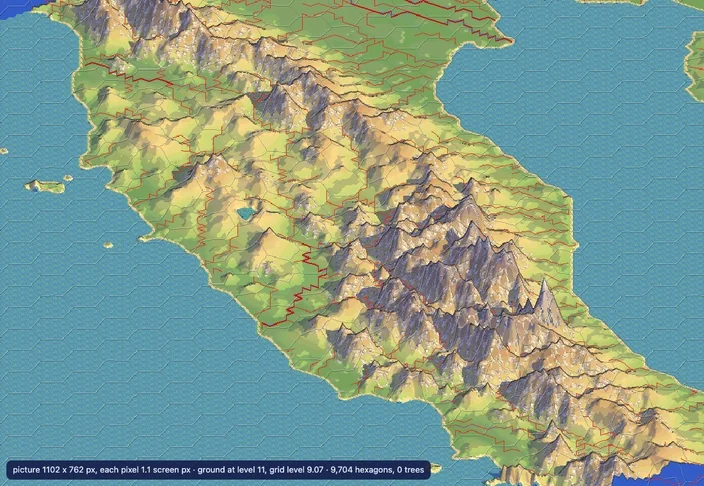
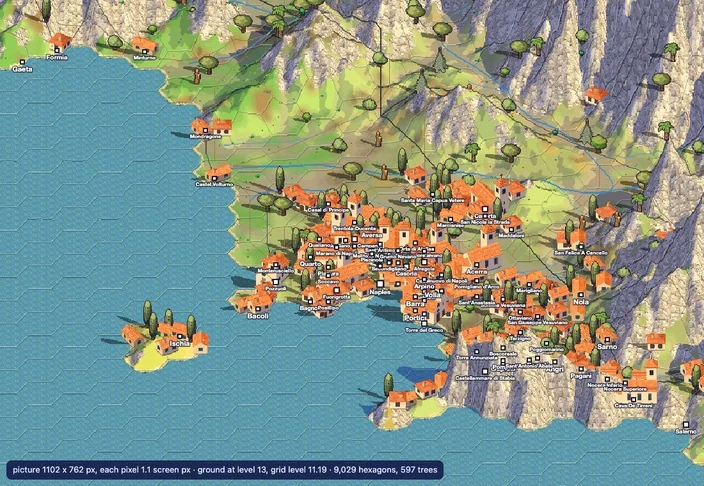
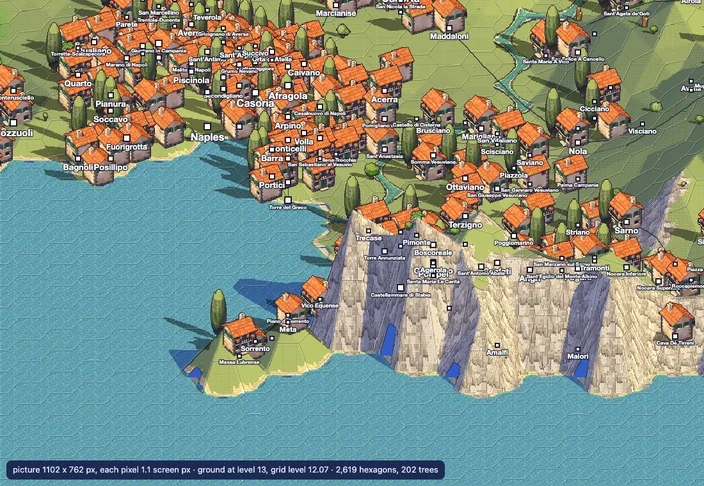
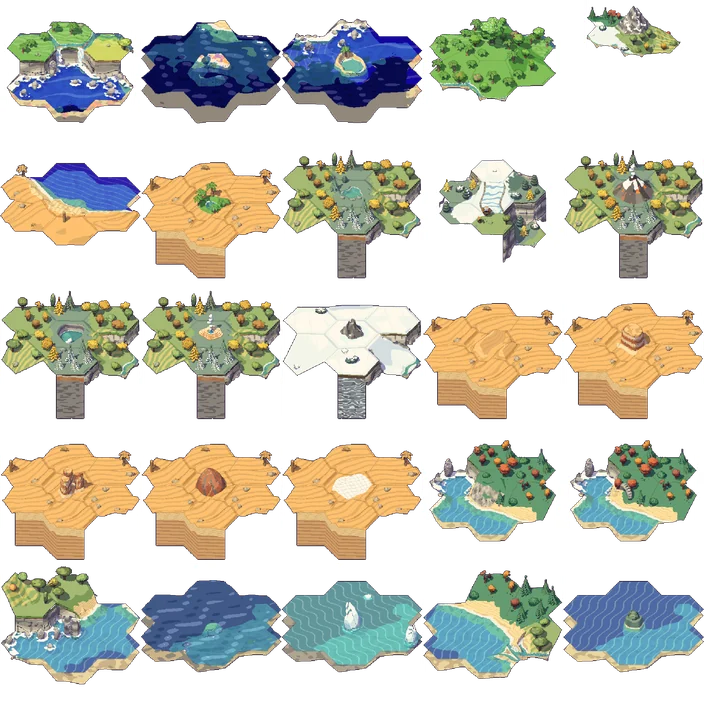
So another idea: what if I used the now 3d landscape, took tiles and asked chatgpt to re-render it as tiles, and then smooth them over? The resulting hexagonal tiles had a somewhat quaint feeling, but again, the geometry was all over the place. ChatGPT is simply not very good at understanding geometry. I then tried Opus to generate these scenarios, the same way it generated the splats, however using the objects in the catalog instead of pixels. It did a pretty decent job I would say, comparing each part side by side.
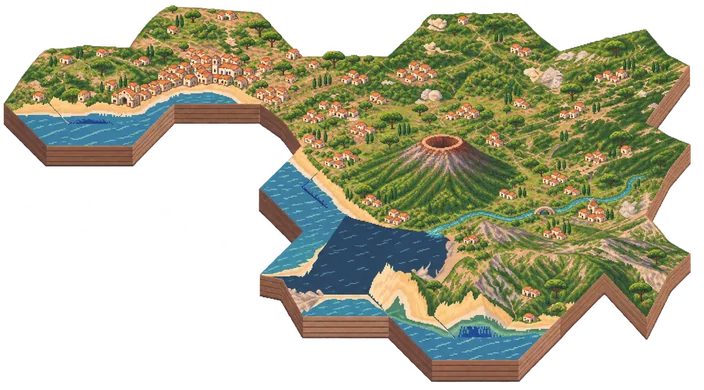
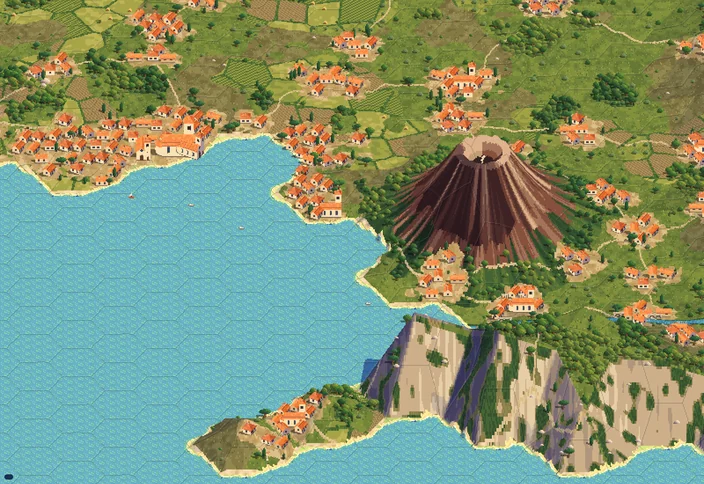
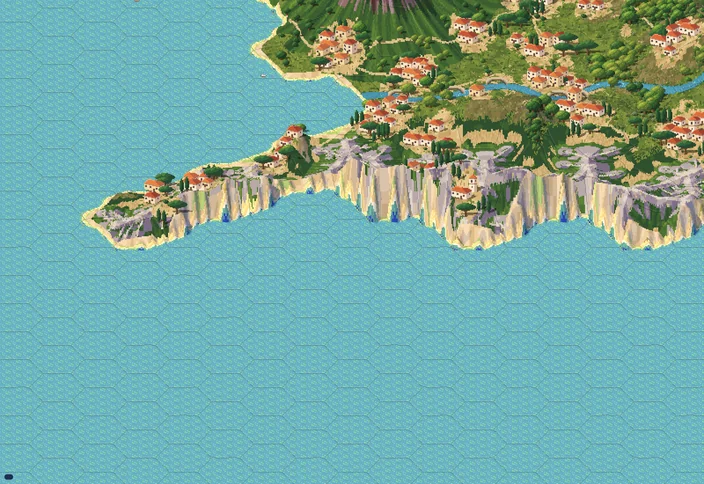
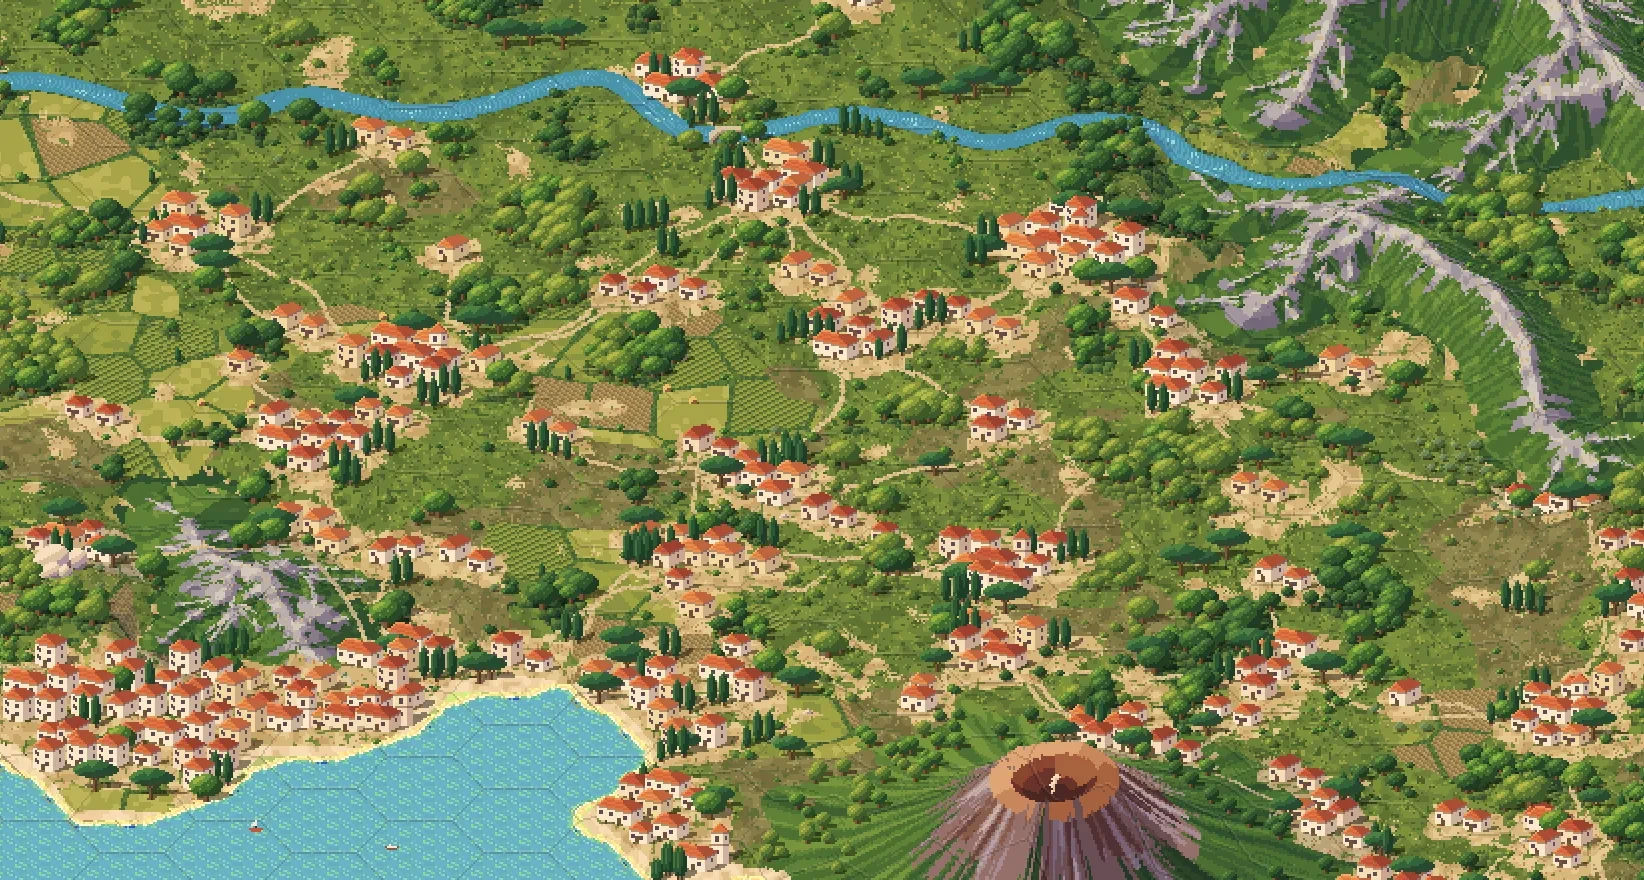
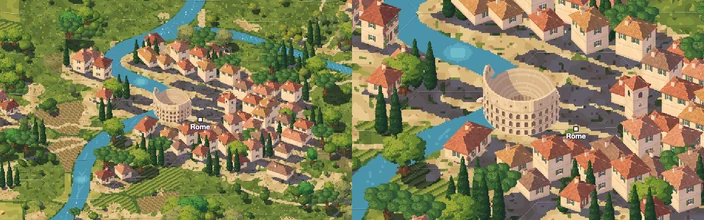
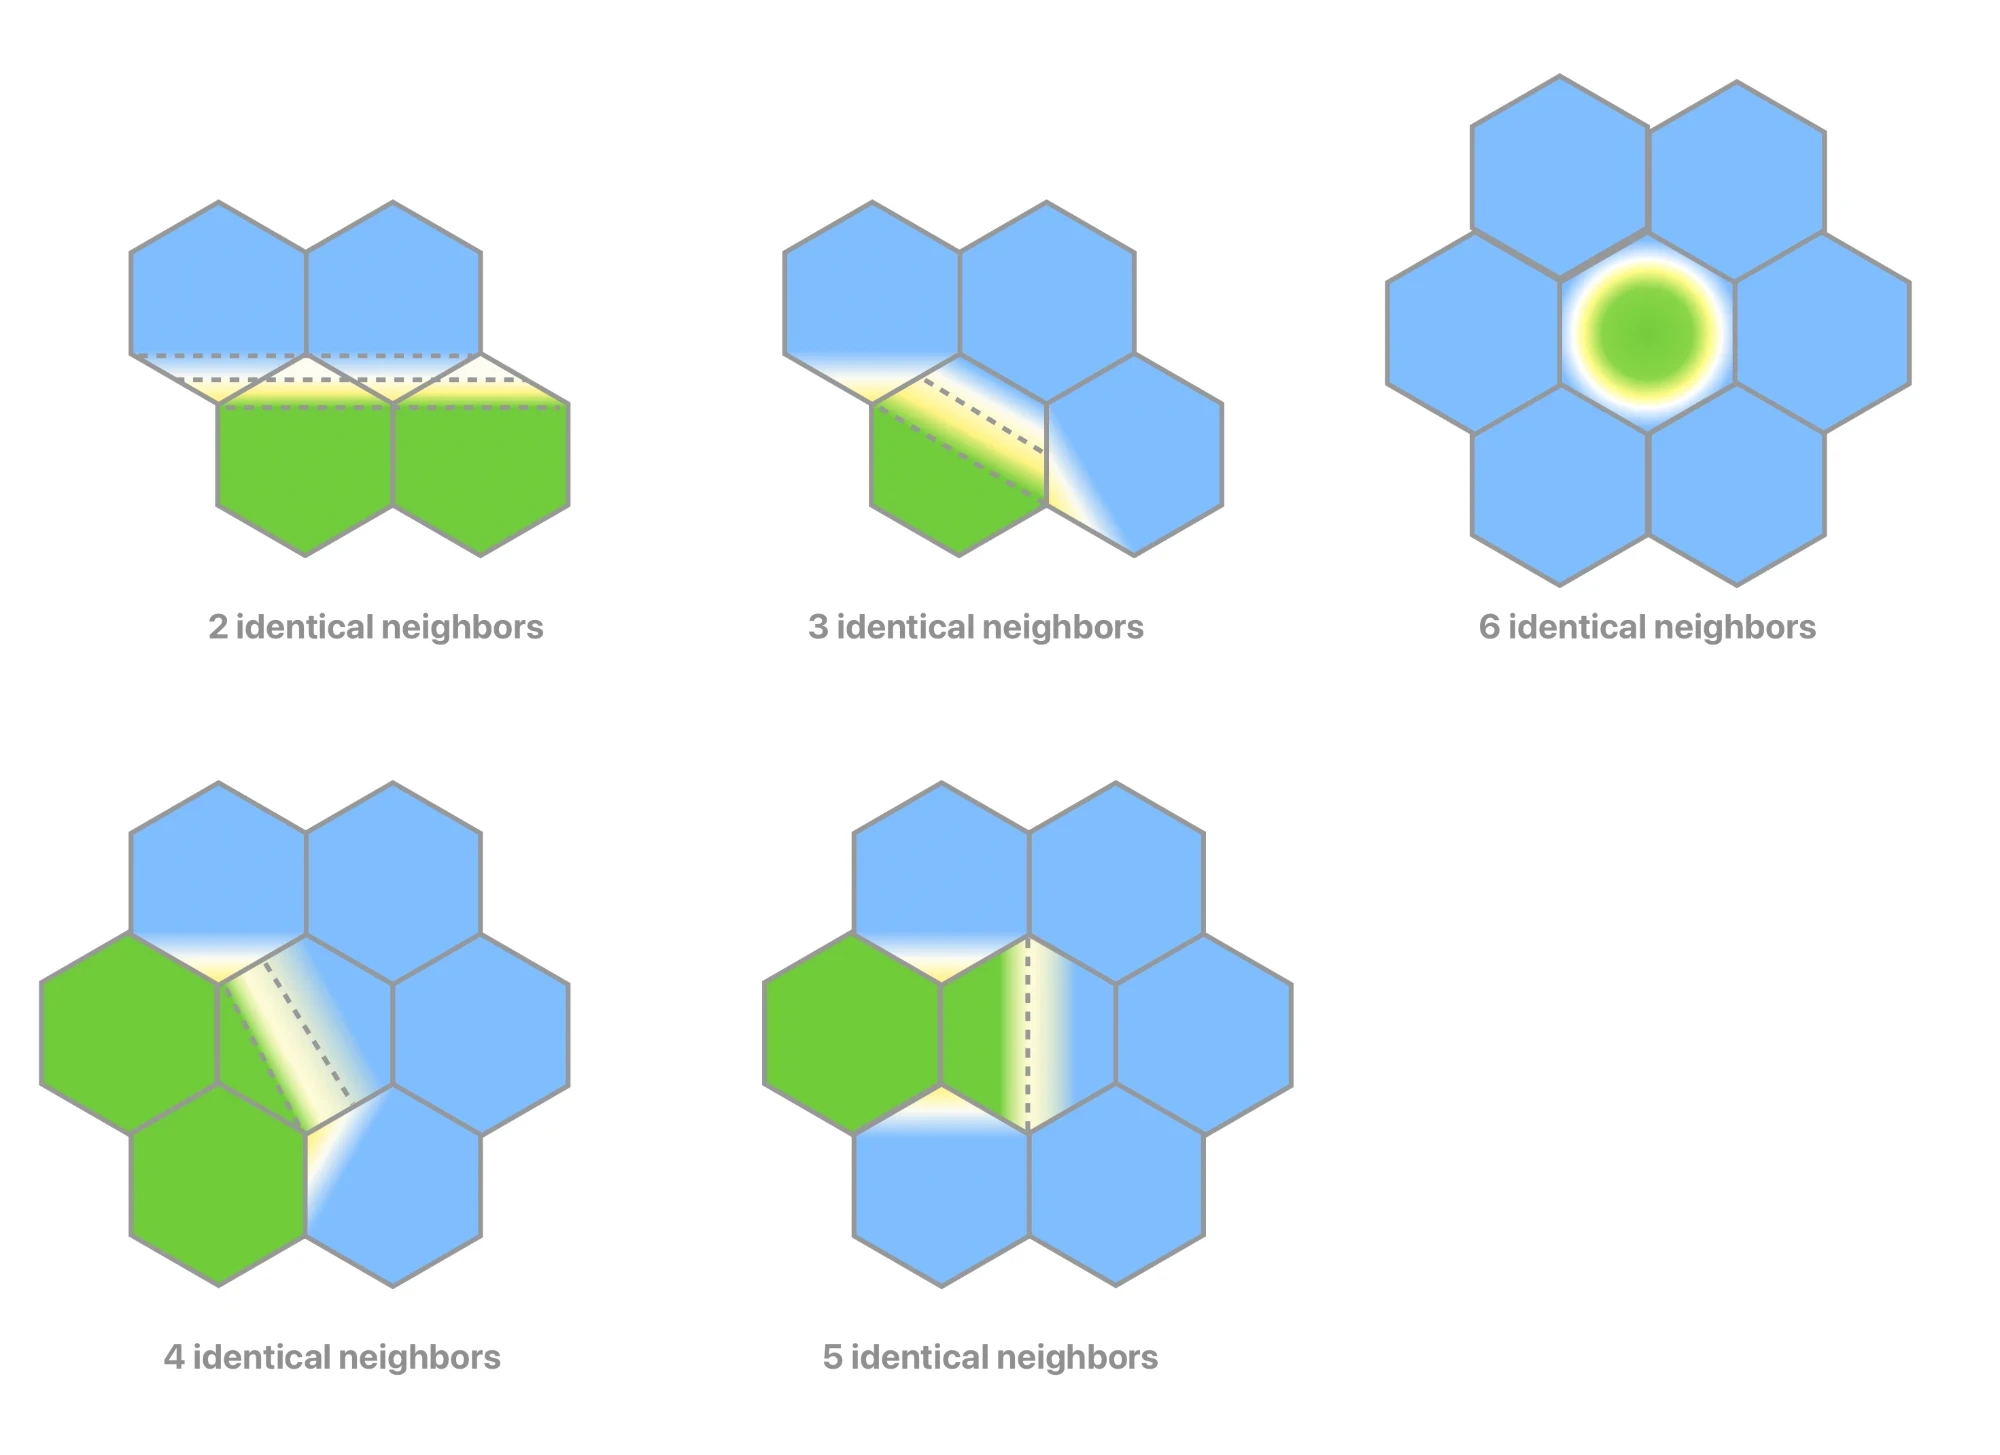
I did the whole of the Italian peninsula this way and as I liked the result I asked it to start going over the world. I created different styles, and started a process of constant feedback: the rivers aren't right, the beaches are too pointy here, we have a bug over there, and the more I gave the feedback the more we found a set of universal rules for placing more tiles.
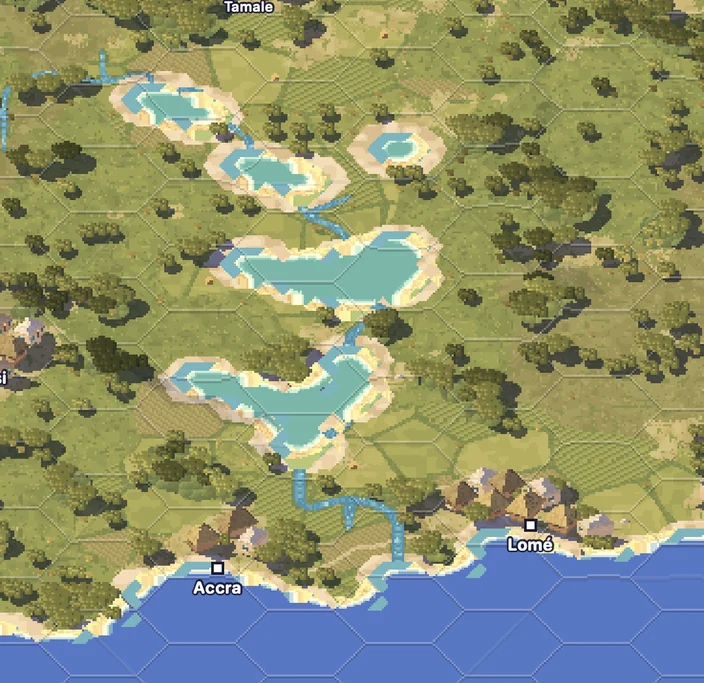
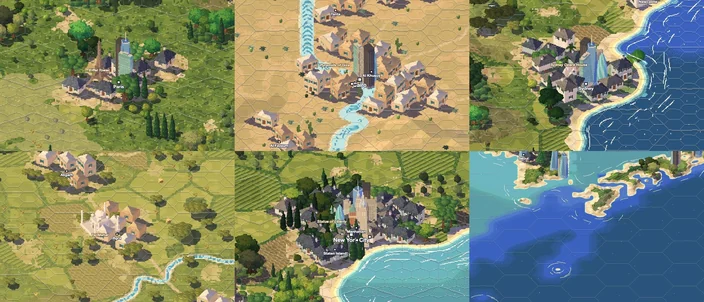
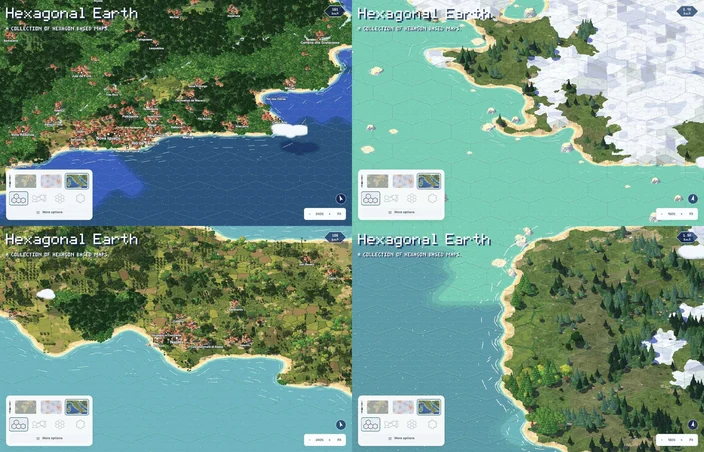
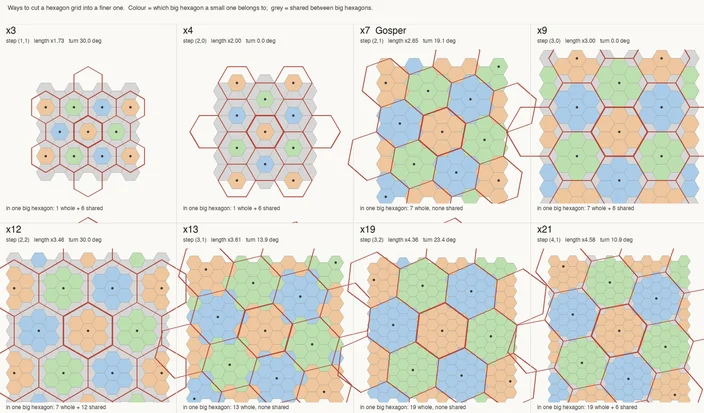
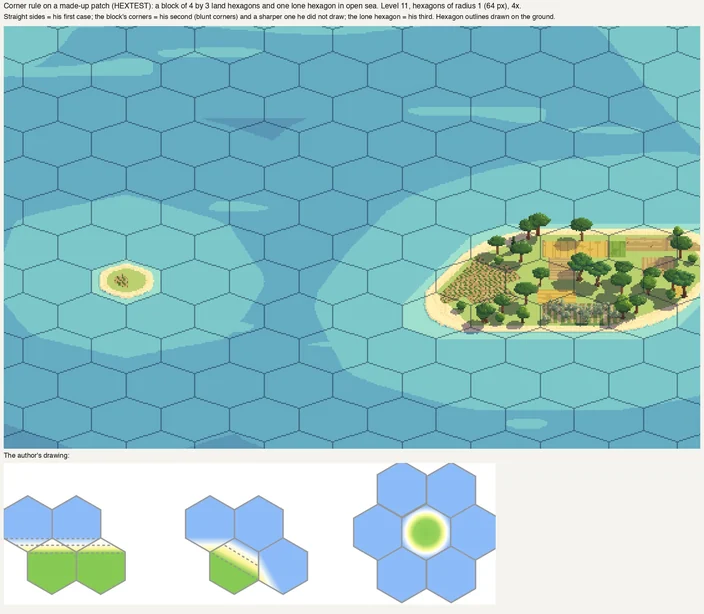
At this point I also realized a big problem and decided to regenerate the whole grid. There are many ways you can split a hexagon into smaller identical ones, and since the beginning of the project in 2023 I had picked a 1:7 format because every child is a direct descendant of the parent. This however created an issue that it means that every new level is √7 of the next one in terms of size, while I wanted to keep integer pixels. So I made the decision to change the whole grid to a 1:4 arrangement, which allows the pixel doubling to match the hexagonal doubling. Now the app changes the image everytime the user zooms to half the original size, but it only changes the actual scene at every two doublings. So each tile you see in a view will turn into 16 tiles in the next.
But seeing the tiles over and over again made me realize how flat it all looked. The problem is that so far we were generating flat images from 3d data and then placing them in the map. My hope was that I could just save a data about the placement of each element and the browser could place them on the map while you dragged. But while the file sizes were indeed smaller, it also meant the browser had to place thousands of individual sprites on the fly, which was a bad experience, so I needed to generate the static images anyway. And since we are using 3d data, why not do it directly: use the 3d splat pixel to make a whole scene and then generate the scene as a single image? The results were stunning and it's the first time I felt that I had something I could actually share.
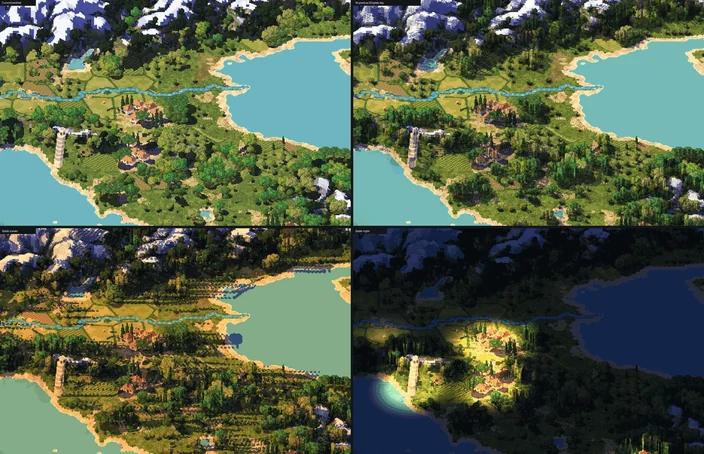
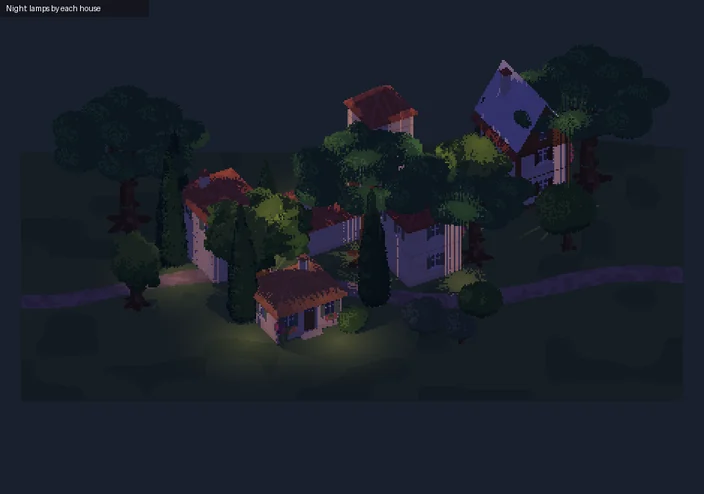
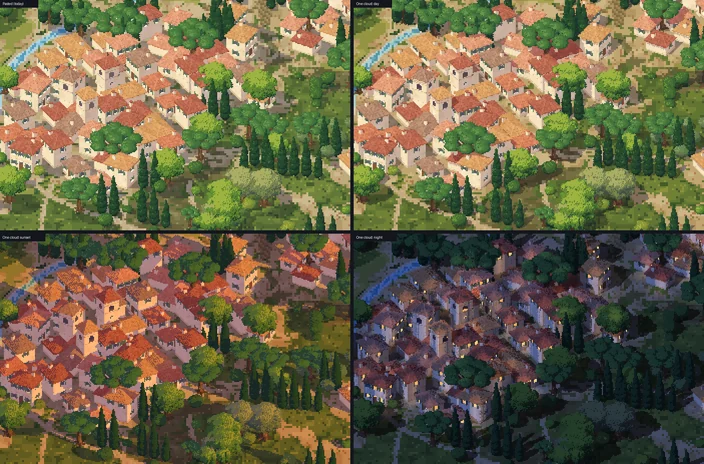
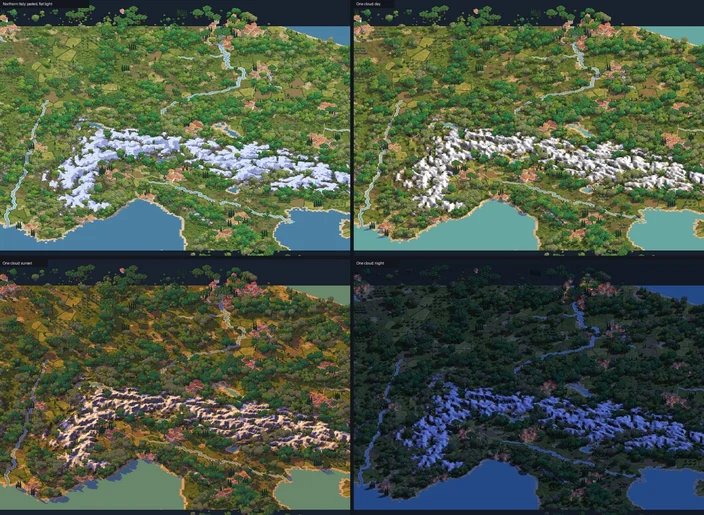
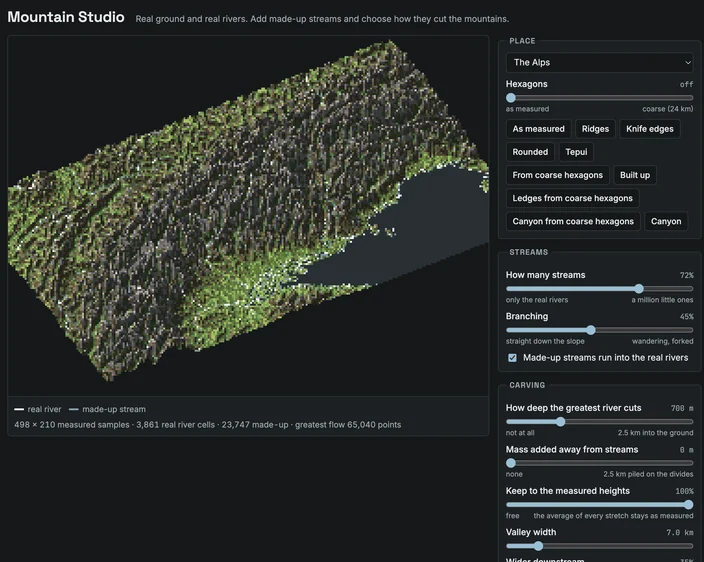
But with the more realistic lighting, I had lost the original painted feeling. And mountains had lost a lot of their personality. So I spent a lot of time refining how the mountains look. A real mountain is not only its relief, but most important its river systems. It's what carves deep valleys and makes them greener. Fable created me a tool specifically to set the
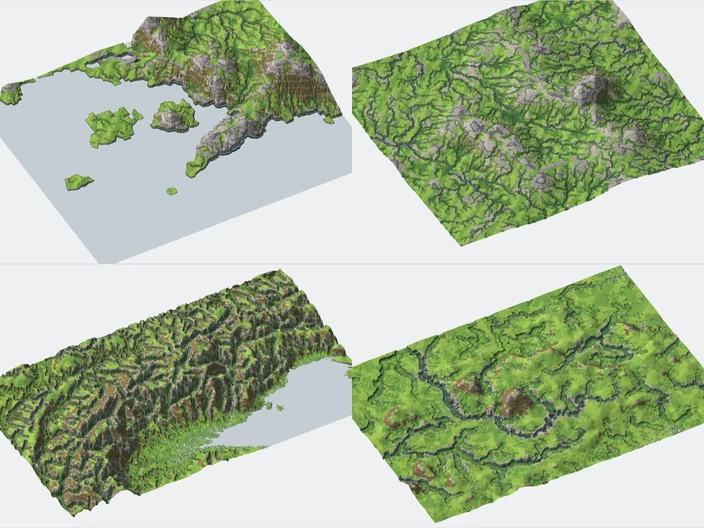
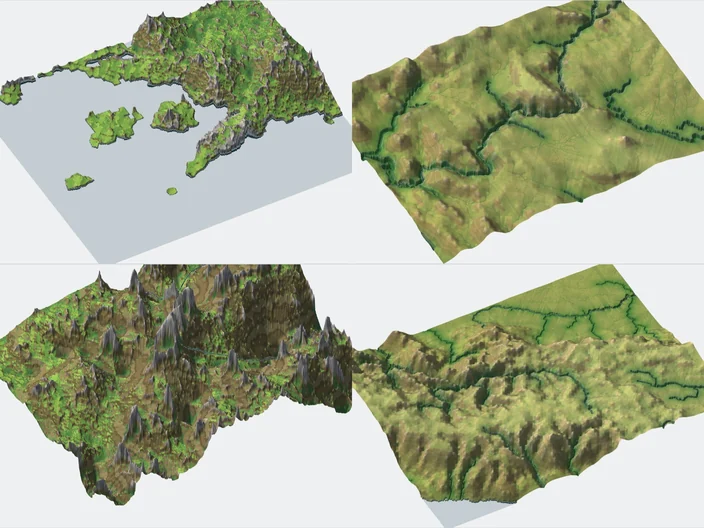
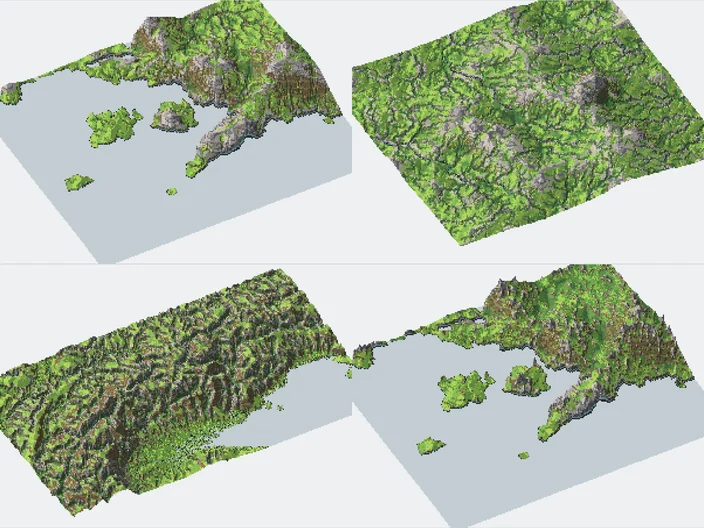
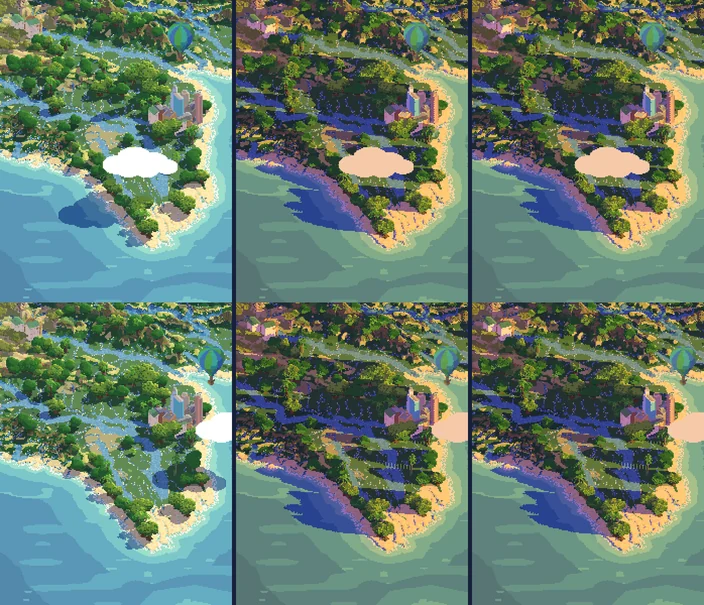
This is the version that ultimately went live. But it also went through multiple revisions. For example, in order to generate multiple lighting settings, Claude was generating 3 different tiles. And when a cloud or an airplane would cast a shadow below, it would merge both, darkening the same pixels twice, which is not how shadows are supposed to work. I asked to rework so it keeps 3 images: the base illustration, a bitmap shadow mask and a height layer. And when working with AI tools you need to continuously remind of rules you had already set long ago, for example how you are rounding the hexagons.
Is it Slop?
So return you the first question: is it slop or not? It's up to you. I hope that by showing the process I have convinced you that a project like this is not at all a single prompt in chatGPT saying "make me a pixel art map of italy". Maybe that can work, but it's not what I intended to build. It's not a "low effort" content: I did not code the website, but I typed over 39 thousand words (well some I dictated) in just the past two weeks, not counting all the work done previously to get the non-isometric version up in the first place. I did not directly paint any of the 30 thousand tiles in the website, but I discussed it, directed it and spent over 75 hours just getting to this point. Is it worth it? Well, I am a believer that a time you enjoy wasting is no wasted time, and I enjoyed a lot seeing this come to life. If it's worth to anyone else it's an open question.
I could've told a different story. There are lots of one shots I could take that many people would feel they were good enough. But weren't "mine".
What's next?
As I said, the number one complaint I got was about the data. I spent a long time refining coastal and climate data, but did not mind much whatever Claude was using to decide which cities are visible or how it's shown on the site. It downloaded fine population data for the whole world so I'm now capable of showing information until the neighborhood level (don't want to go much beyond that for now). I also spent a lot of time refining exactly how the coasts are drawn in multiple levels so they round to the next hexagon in an elegant way but in a way that islands remain islands and peninsulas remain peninsulas.
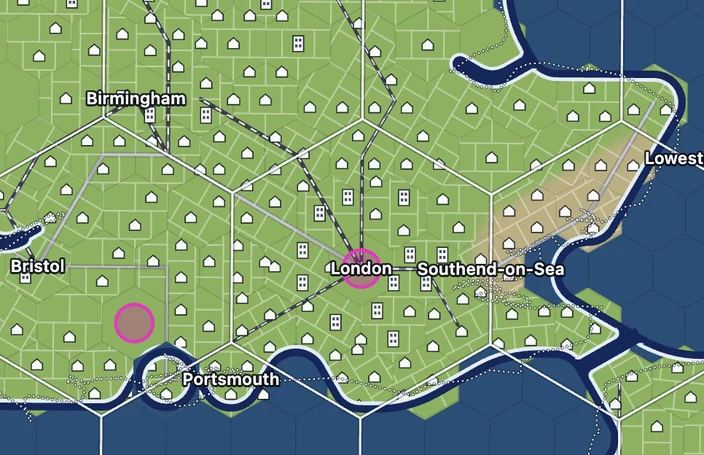
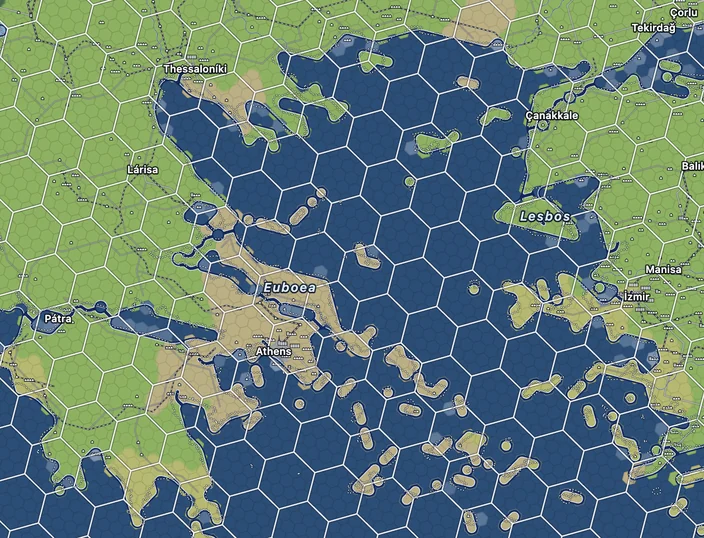
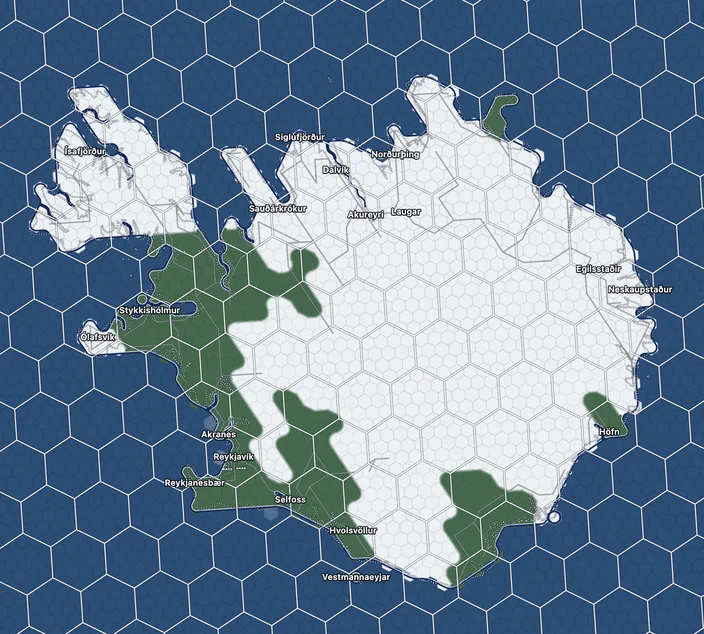
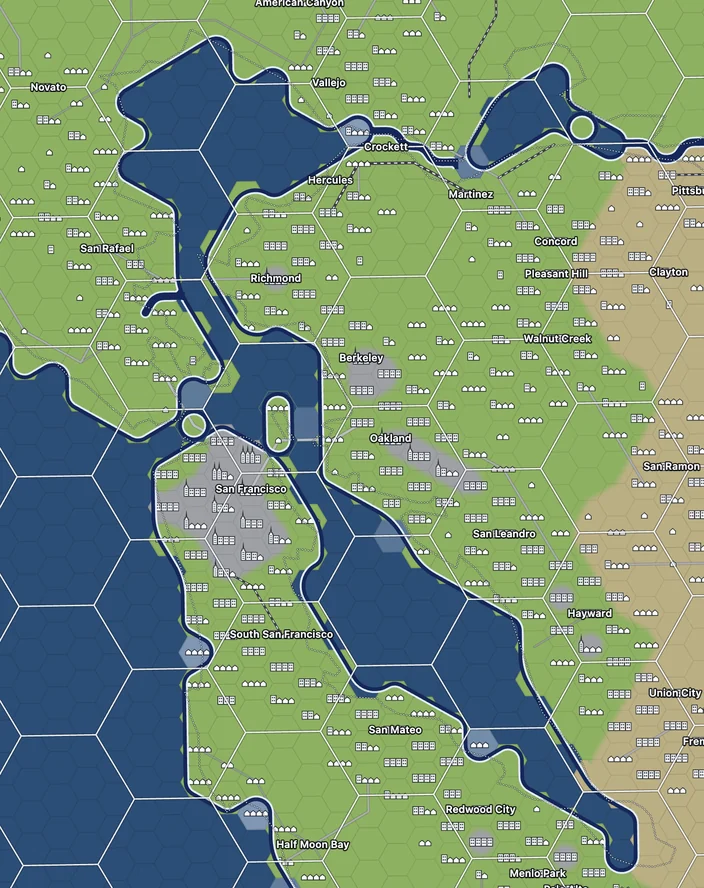
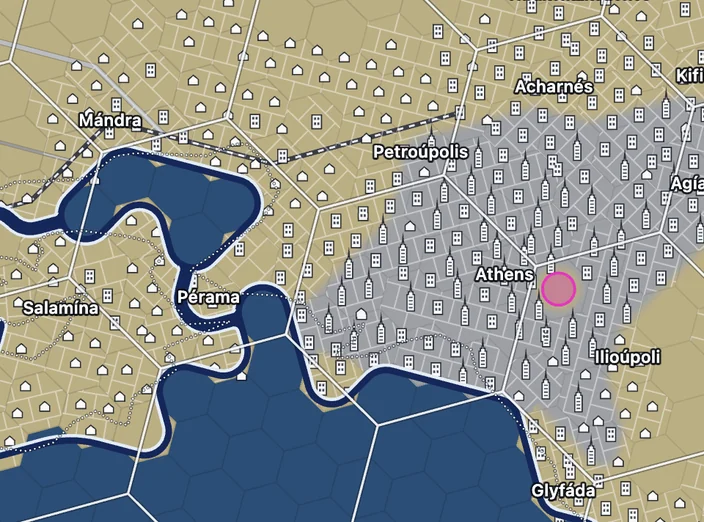
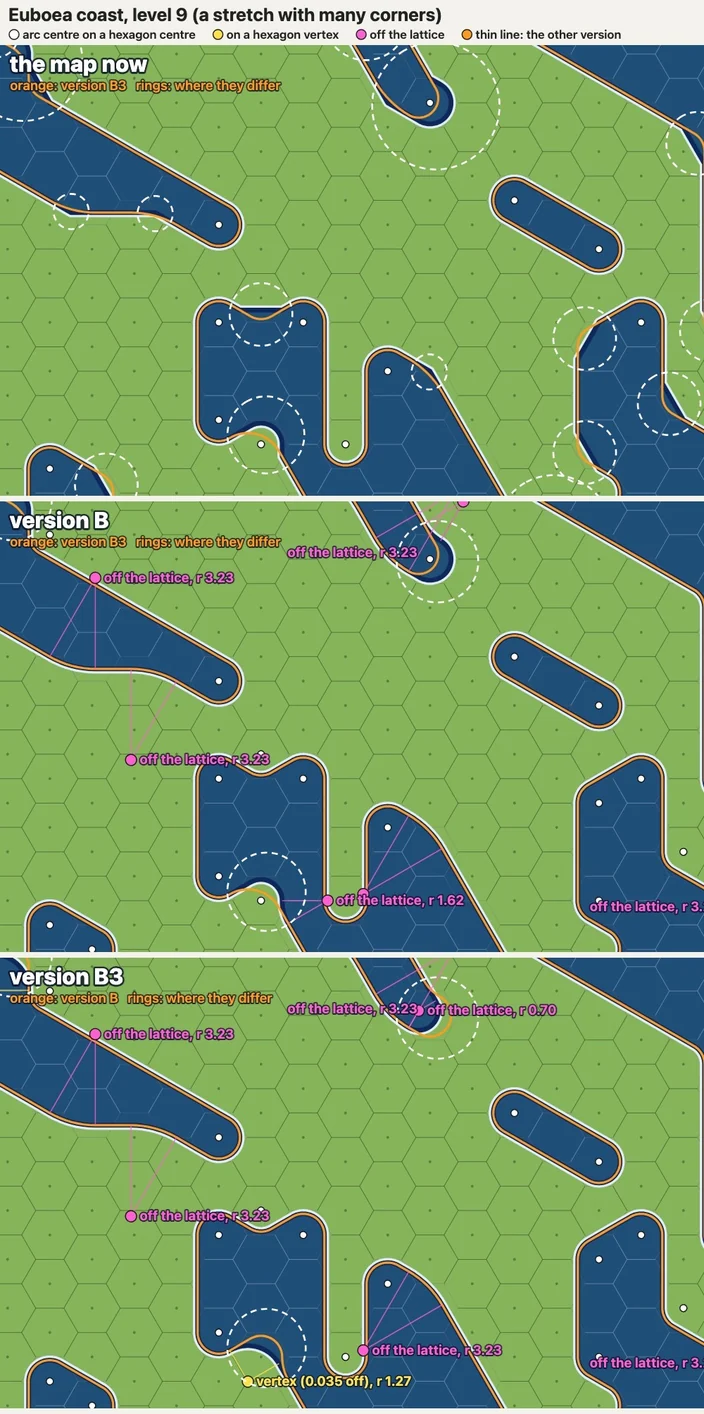
I will probably be working on that for the next weeks so expect more refined data, with road and rail network and better labeling. Don't expect to use this for directions though.
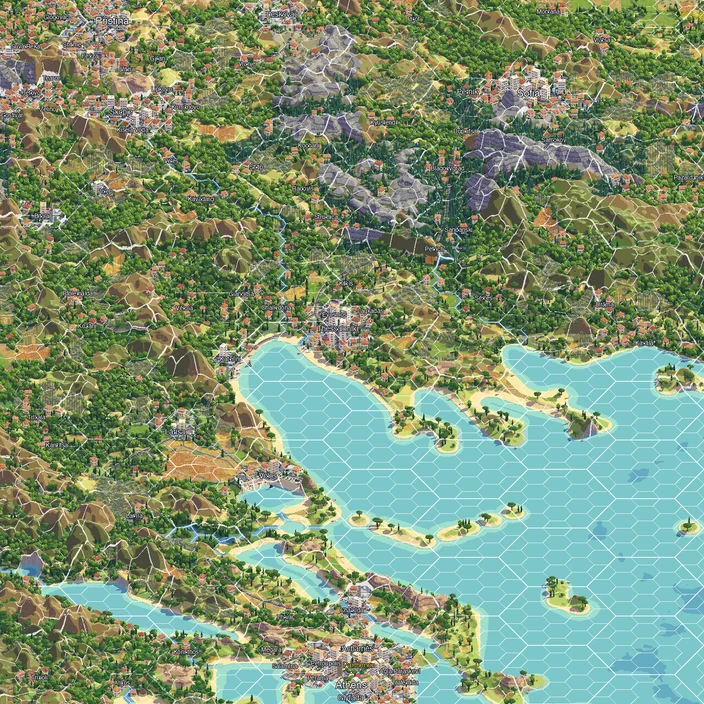
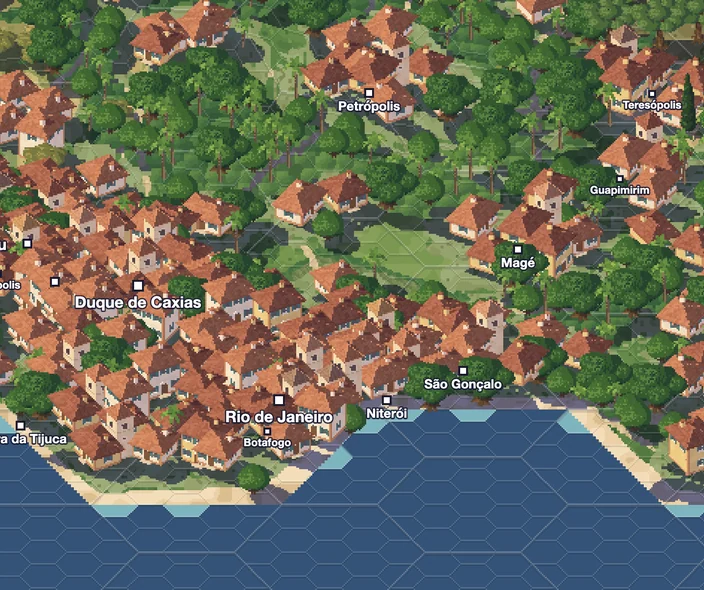
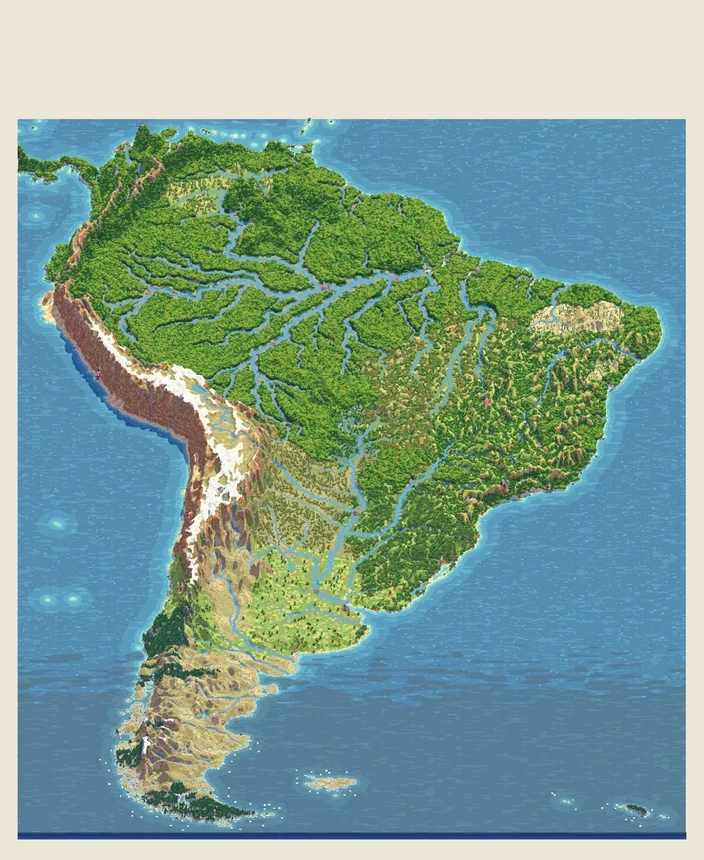
To finalize, here's a picture of Greece, a preview on how I expect the new tiles to look like, for a good friend.